Blog

  • Why the BoJ rate hike pause is rattling yen carry trades

    Why the BoJ rate hike pause is rattling yen carry trades

    Nikkei 225 futures trade at 65,491 yen as of August 21, 2026, which sits 726 yen below the August 20 cash closing price of 66,216.79 yen. The cash index rose 890.37 yen on August 20, but the US market movement after the Tokyo close caused the futures to drop. This discrepancy between the cash index and the futures reflects the volatility in Western markets following the Tokyo session. The Nikkei 225 remains 30.10% higher year-to-date.

    The yen carry trade remains a persistent threat to global equity stability.

    Why the BoJ rate hike pause is rattling yen carry trades (2)

    When the Bank of Japan hiked rates in early August and announced a gradual tapering of its quantitative easing program, the trajectory of the Japanese yen changed overnight, causing Japanese investors to sell US momentum stocks to cover their unhedged holdings. These investors previously used accumulated dollars to buy US equities and bonds on an unhedged basis because the yen depreciated for years and the Bank of Japan kept policy rates low. Morgan Stanley estimates that $500 billion in outstanding yen-funded carry positions exist despite the partial unwind in August.

    The August 2024 unwind remains a benchmark for current market fears. During that period, the S&P 500 dropped 6% in three days and the VIX reached 65. In August 2024, Bitcoin dropped from $62,000 to $50,000 in 48 hours as overleveraged positions faced margin calls.

    The Bank of Japan and the bond market

    The Bank of Japan pushed policy rates to 1% on June 16, 2026. This follows a 25 basis point hike to 0.75% on December 19, 2025. The current policy rate sits at 1% while the central bank maintains its existing quantitative tightening schedule. Japan’s inflation rate for July 2026 reached 1.90%, while the previous month recorded 1.60%.

    The 10-year Japanese Government Bond yield reached 2.95% this week. This follows a rise of 4.4 basis points on August 20. In August 2026, the 10-year JGB yield reached its highest level in roughly three decades. The US-Japan 10-year yield spread stands at approximately 1.8 percentage points.

    The Bank of Japan signals a conditional bias toward further tightening as long as economic activity and inflation align with its projections. Policymakers want to avoid a rapid, one-way rise in 10-year and 30-year JGB yields to prevent premature tightening of financial conditions. The Nikkei market participant survey shows over 60% of participants expect a September rate hike.

    Will the Bank of Japan’s next move trigger another flash crash?

    Semiconductor volatility and the Nikkei

    The semiconductor sector drove the recent Nikkei volatility. Kioxia Holdings fell 10% during the Wednesday session. Advantest dropped 3.05% to 34,610 yen. Tokyo Electron fell 0.90% to 56,000 yen. Fujikura fell 8.4%. Taiyo Yuden fell 12.19%. Murata Manufacturing fell 9.17%.

    The Nikkei 225 is heavily influenced by high-priced stocks. Advantest alone accounted for 42.8% of the total rise on August 13. The top five semiconductor and electronic component stocks – Advantest, Tokyo Electron, Ibiden, Murata Manufacturing, and TDK – accounted for 83.6% of the Nikkei Average rise on that day.

    You already know how fast the Nikkei 225 slides when semiconductor earnings miss.

    On Wednesday, August 20, the Nikkei 225 saw an intraday swing of over 2,100 points. The index dropped from a Monday high of 69,220.25 to a Wednesday low near 65,326. This represents a peak-to-trough decline of roughly 5.6%. The decline concentrated in technology names, specifically chip-and-AI shares.

    The yen intervention and carry trade rebuilding

    The Japanese government and the Bank of Japan intervened in the foreign exchange market on July 30 and July 31. The yen’s value surged by up to 3.3% during the July 30 session. The yen previously reached 164 per dollar before the intervention but recovered to around 157. The yen now trades at 159.425 against the US dollar.

    Japanese investors use periods of yen strength to rebuild carry trade positions. Japanese investors net bought more than 5 trillion yen of foreign equities and long-term bonds over the two weeks ending August 15. This compares to a net selling of over 300 billion yen in the prior two weeks. Jesper Koll, an expert director at Monex Group, states that intervention "turbo charged" the carry trade for fundamental and long term investors.

    The market targets the 155 yen per dollar level. The International Monetary Fund counts interventions conducted within three business days as a "single instance." Global hedge funds held 124,575 contracts worth approximately $9.5 billion betting on yen weakness as of July 28.

    US asset exposure and Euro parity

    The US dollar cannot remain too strong or too weak. Problems occurred in February 2016, March 2020, and October 2022 when the US dollar surged. Foreigners selling US assets to raise dollars create liquidity risks. If the Federal Reserve cuts interest rates, the narrowing of global interest-rate differentials could cause the US dollar to depreciate. The Fed funds rate currently sits in the 3.5% to 3.75% range. Markets price two additional cuts next year to around 3.0%.

    The Euro area holds a much larger volume of US assets than Japan. Euro area nations ran persistent current account surpluses with the US for the last 15 years. Most of these surpluses went into US fixed income. If the euro appreciates, holders of US assets must either hedge their positions or sell US-dollar-denominated assets.

    Japanese investors face higher costs when hedging currency risk. A Japanese investor buying a 10-year Treasury with currency hedging receives a -1.57% yield. This yield remains much lower than domestic bond yields.

    Emerging market and crypto risks

    The yen carry trade impacts high-yield assets like Bitcoin and emerging market currencies. Bitcoin trades at $91,000, having retreated from excursions above $100,000 earlier this year. In August, Bitcoin fell from $62,000 to $50,000 in 48 hours. The correlation between yen carry trade dynamics and crypto prices remains significant.

    Emerging markets face high exposure to yen-denominated debt. Indonesia, Thailand, and Malaysia have strong trade ties to Japan. A sharp yen appreciation makes servicing yen-denominated debt more expensive. In August, emerging market portfolios attracted $45 billion. This included $41.5 billion in debt flows to Mexico and Brazil. Equity flows into emerging markets fell to $3.3 billion. Ex-China EM stocks saw $7.4 billion in outflows.

    The US-Japan 10-year yield spread remains at 1.8 percentage points.

    The divergence of US and Japanese rates

    The US Treasury announced an increase in bond buybacks from $2 billion to $4 billion per operation on August 19. This led to a decline in US long-term interest rates and a rise in US stocks. The Tokyo market followed this trend on August 20.

    The Bank of Japan interest rate remains at 1.00% as of July 2026. The US Federal Reserve maintained its policy target in July 2026. The Fed Chair noted that economic activity expands at a solid pace.

    The yen carry trade creates global volatility.

    Asset Class Data Point Value
    Nikkei 225 Cash Closing (Aug 20) 66,216.79 yen
    Nikkei 225 Futures (Aug 21) 65,491.00 yen
    USD/JPY Current Rate 159.425
    Japan 10-year JGB Current Yield 2.95%
    US 10-year Yield Current Rate 4.641%
    Bitcoin Current Price $91,000
    BoJ Policy Rate Current Rate 1.00%
    Yen Carry Position Outstanding Amount $500 billion

    The Nikkei 225 remains sensitive to US tech momentum. Advantest is 34,610 yen. Tokyo Electron is 56,000 yen. Sony is 3,870 yen. Toyota Motor is 3,077 yen. Mitsubishi UFJ Financial is 3,608 yen. Sumitomo Mitsui Financial is 6,794 yen. Mizuho Financial is 26.00 yen. Advantest is 34,610 yen. Recruit Holdings is 16,970 yen. Fast Retailing is 71,540 yen. Hitachi is 5,433 yen. Apple is 313.45 yen. Microsoft is 496.37 yen. Meta is 576.14 yen. Nvidia is 209.66 yen. Tesla is 345.82 yen.

  • Arsenal’s corner supremacy and the high-line defensive shift

    Arsenal’s corner supremacy and the high-line defensive shift

    Arsenal lead the Premier League with 16 goals from corners this season. This total matches the record held by the 2023/24 Arsenal squad. Mikel Arteta uses set-pieces as a primary offensive engine. During the 2-1 win against Chelsea, all three goals resulted from corner-kicks. The team relies on targeted isolation and second-phase pressure to exploit dead-ball situations. In the Saliba opener, Arsenal used William Saliba as a vertical anchor while Gabriel provided decoy runs to create space in the six-yard box. This movement pinned Chelsea goalkeeper Robert Sanchez inside his own goal-line. The second goal came after Jurrien Timber exploited the rebound zone. He made an underlapping run to create a 2v1 overload, and his resulting shot led to a corner.

    Arsenal’s high defensive line, which maintained an average distance of 44.2 meters from their own goal, allowed David Raya to act as an auxiliary center-back when sweeping up long-ball releases. This aggressive perimeter increased their defensive distance by 12% from the 2025 average. Raya earned an 8/10 rating for his ability to intercept long balls 18.5 meters outside his box. When the ball shifted to Chelsea’s right flank, the far-side fullback tucked inside to create a temporary back three. This pendulum shift neutralized Liam Rosenior’s preferred overloaded transitions. You might see how this high line forces opponents into low-value areas. Arsenal’s defensive flexibility allowed them to maintain a 4-4-2 shape when they reached the defending phase.

    Arsenal's corner supremacy and the high-line defensive shift (2)

    Tottenham’s defensive overhaul focuses on stability.

    The club signed Jan Paul van Hecke for £52 million. They also brought in Marcos Senesi and Andy Robertson on a free transfer. These signings follow a season where Tottenham conceded an average of 1.5 goals per match. Roberto De Zerbi can now deploy a back five including Senesi, Van de Ven, and Van Hecke. This flexibility helps the team in games where they expect to see less of the ball. Porro signed a new deal until 2031 to secure the right-back position. The squad includes more options like Djed Spence, Destiny Udogie, and Ben Davies.

    Tottenham’s interim manager Igor Tudor faced a difficult 1-4 defeat against Arsenal. Spurs used a 3-5-2 shape that shifted into a 5-3-2 defensive block. This shape relied on the midfield three to cover inside channels and funnel the ball wide. However, the physical demand caused their intensity to drop. Arsenal countered this by moving central midfielders away from the middle. This increased the pressing distance for Tottenham’s midfielders. Eberechi Eze scored his first Premier League goals since a hat-trick last November, while Viktor Gyokeres scored his ninth and tenth of the season to boost the Gunners. Arsenal’s winger Bukayo Saka also found space against Micky van de Ven when Jurrien Timber moved high.

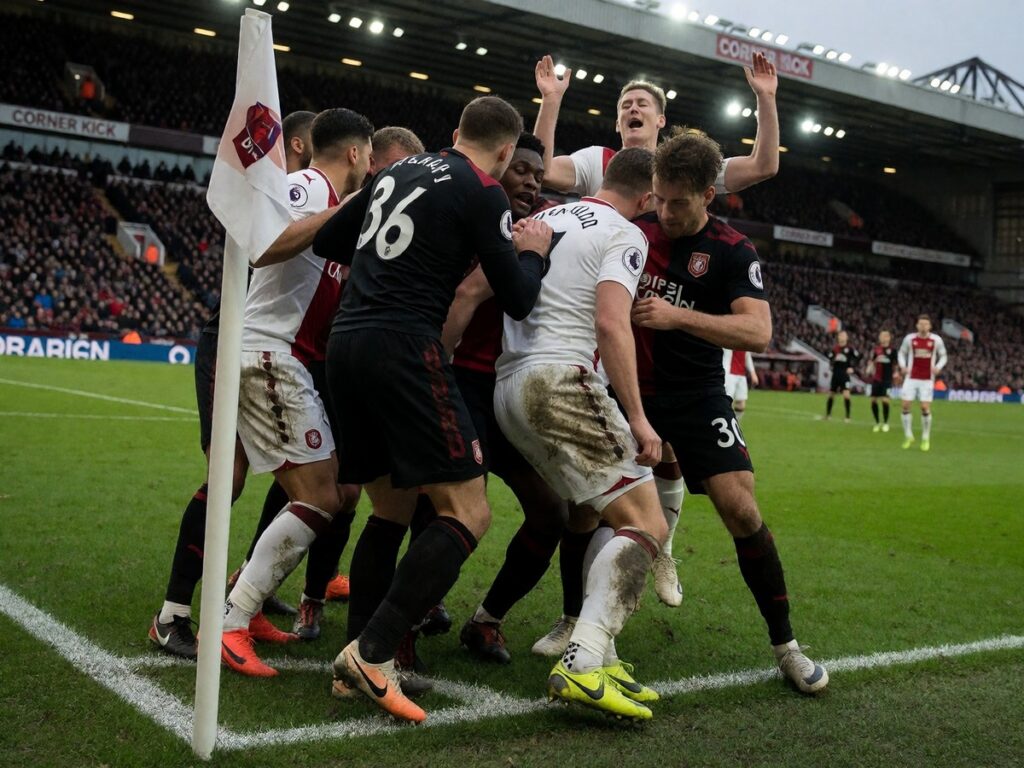
    The Premier League Big Six continue to use inswinging corners despite new IFAB rules. Pre-season data shows that 73.7% of Big Six corners were inswingers. This differs from the 51.2% of inswingers seen during the 2026 FIFA World Cup. IFAB introduced VAR interventions for attacking fouls on corners before the ball is in play. This rule change aims to reduce the "meat-wall" tactics involving pinning and grappling. International teams, including England, opted to use outswingers as a more prominent feature. In the Premier League, clubs still favour low-risk routines built around inswinging deliveries into a crowded six-yard box.

    Chelsea’s defensive struggles center on set-piece transitions. The club conceded 14.05 xG from dead balls this season. This flaw was exposed during their loss to Arsenal. Arsenal’s attackers used a blocker strategy to screen Robert Sanchez’s line of sight. This forced a mistake from the goalkeeper. Liam Rosenior noted that players face significant holding and grappling during deliveries. Chelsea’s failure to defend these moments has left them on a three-game winless run. This weakness in the defensive line was highlighted by the fact that they conceded five goals in three matches against Arsenal.

    Spurs struggle at home.

    Under Thomas Frank, the team kept seven clean sheets in 21 matches. This was an improvement over the previous season. Frank also utilized a high percentage of long balls. Twelve percent of Tottenham’s passes travelled 35 or more yards. This approach aims to find forwards quickly. Tottenham also ranks bottom of the league for through balls attempted with just 11 in their 21 games. This lack of incisive passing makes it hard to break down low blocks.

    Statistic Arsenal (vs Chelsea) Chelsea (vs Arsenal)
    xG 1.42 1.68
    Goals 2 1
    Corner Goals 2 0
    Defensive Distance (m) 44.2 N/A

    Tottenham and Chelsea met in a penultimate game of the season. Chelsea’s interim manager Calum McFarlane switched to a 4-2-3-1 formation. Tottenham used Roberto De Zerbi’s 4-2-3-1. Chelsea’s Enzo Fernandez scored from long range. The match ended 2-1 to Chelsea. Tottenham’s defensive organization was poor enough to allow space for Pedro Neto to run into. Arsenal’s momentum in the title race rests on these small margins. They lead the league by five points. Tottenham face relegation concerns. Chelsea face a fight for fourth. Will Chelsea find a way to stop the Arsenal corner onslaught before the season ends?

  • Liverpool’s Anfield Road expansion: myths vs facts about FSG impact

    Liverpool’s Anfield Road expansion: myths vs facts about FSG impact

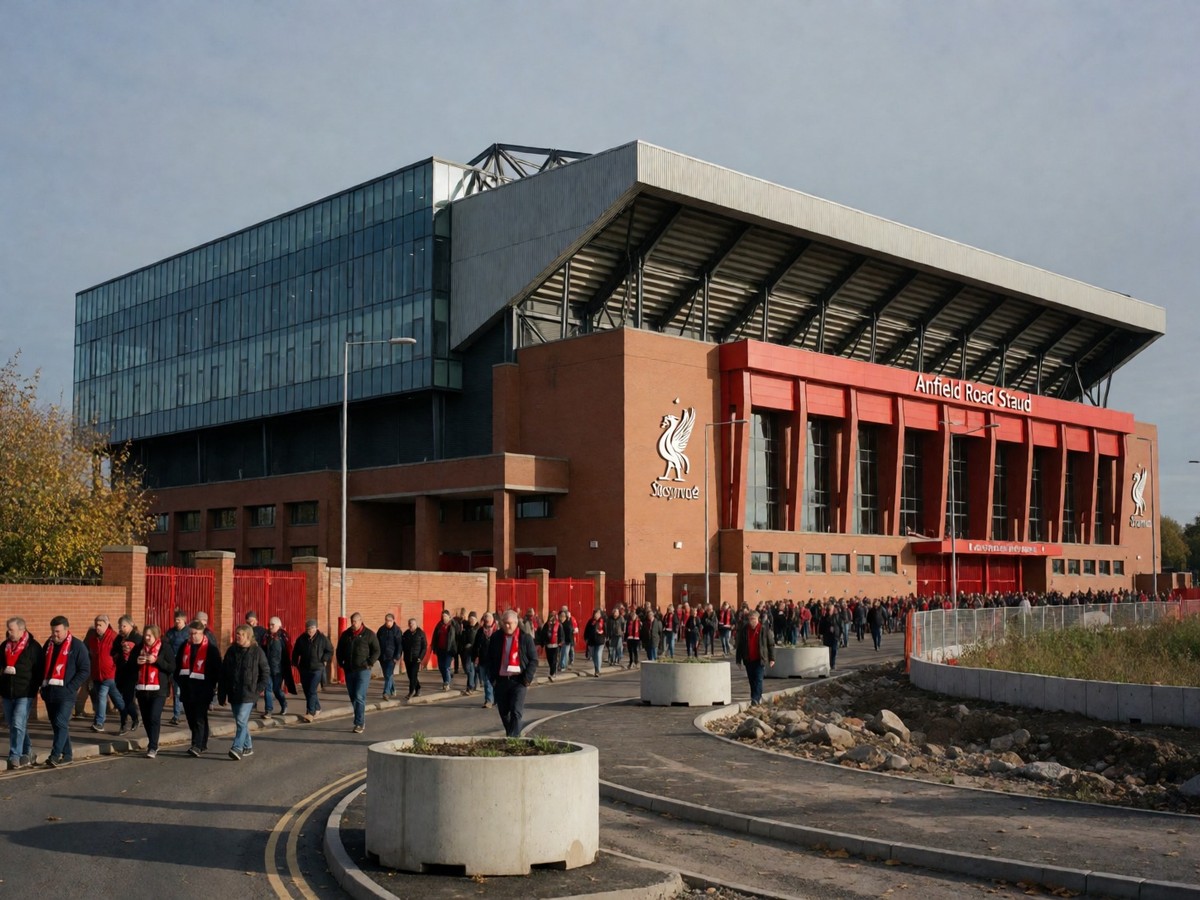
    The Anfield Road Stand expansion added 7,000 seats to the stadium. This project increased the total capacity to 61,276. The new seats include 5,200 general admission seats and 1,800 hospitality seats. Liverpool first used the partially complete upper tier in December 2023 against Manchester United. That match saw 57,158 attendees. In February 2024, the stand reopened for a match against Burnley, which drew 59,896 fans. The club then set a record in March 2024 when 59,947 fans attended a match against Manchester City. The project reached final completion in March 2025 after the club finished roof cladding and hospitality upgrades. The club received a General Safety Certificate from Liverpool City Council in March 2025. The expansion of the Anfield Road Stand added 7,000 seats, including 5,200 general admission seats and 1,800 hospitality seats, which brings the total capacity of the stadium to 61,276.

    Revenue growth and financial logic

    Liverpool generated £101.7 million in matchday revenue during the 2023/24 season. This figure rose 27.44% from the £79.8 million recorded in 2023. The Anfield Road expansion drove this growth. Before the 2016 Main Stand redevelopment, matchday income stayed between £40 million and £65 million. That project cost £110 million and added 8,500 seats. Liverpool now joins Manchester United and Tottenham Hotspur in the £100 million matchday revenue club. Matchday income remains lower than Manchester United, Arsenal, and Tottenham Hotspur. However, the yield per fan sits behind only Arsenal and Chelsea.

    Liverpool's Anfield Road expansion: myths vs facts about FSG impact (2)

    The club also signed deals worth up to £446.5m in the summer of 2025. They broke the national transfer record twice for Florian Wirtz and Alexander Isak. These funds help the club remain competitive on all fronts. The club is the only English side in the top five of the Deloitte Football Money League.

    Demand remains high.

    The season ticket struggle

    The demand for tickets at Anfield remains high. The season ticket waiting list is closed to new applications. People at the back of the list face an average wait time of 30 years. The club says there are no current plans to reopen the list.

    Even though the capacity is now 61,276, the expansion did not eliminate the shortage of seats. The club distributes tickets through loyalty credits, membership tiers, and ballot processes. Supporters who attend more fixtures accumulate more credits. These credits determine priority when matches go on sale. An extra 7,000 seats simply entered this existing structure.

    How big can Anfield get before Liverpool struggle to sell out every seat?

    Pricing tiers and the atmosphere

    The club sets category B prices between £45 and £55. Category A prices range from £55 to £80. You likely know the capacity rose, but the pricing logic remains a point of contention. Fenway Sports Group intends to increase ticket prices by a maximum of five per cent each year for the next three years.

    Kieran Maguire, a football finance expert, says the club wants to attract a new clientele of better-paying supporters. He suggests that season ticket holders have, to a large extent, outlived their usefulness. Supporters at the Spirit of Shankly group have protested these increases. They want to protect the soul of Anfield.

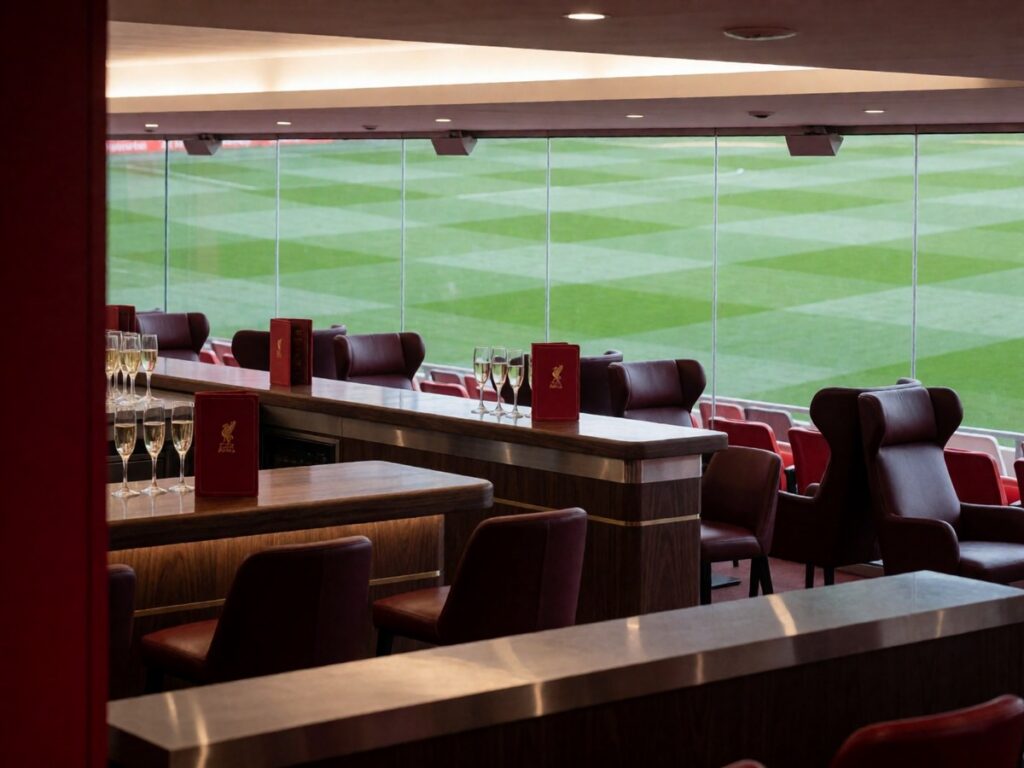
    The atmosphere can feel sedate during matches against lower-table teams. The club allocates a significant section of the new stand to corporate seating. This section serves as a revenue driver. Some fans notice wide open spaces in these sections when guests are not using the facilities. The mix of local fans and tourists is inevitable. Many visitors arrive from overseas for one-off trips. Ticket resale sites list seats in the Kop for much higher prices than the club charges. For a match against Newcastle, one site listed a seat for £469.

    Security and matchday entry

    The club searches every supporter as part of heightened security. This follows the UK government’s passing of Martyn’s Law. The club implemented these searches in November 2024. The decision follows the need to keep the public safe.

    Queues at Turnstile E and Turnstile W can be long. During a match against Barnsley, fans stood in lines that reached the club shop. This impacts the matchday experience. Tom Baker, a fan from Somerset, missed an early goal because of these queues.

    The club works to manage these entry points. Paul Cuttill, the club’s chief operating officer, says the club reviews the deployment of stewards at pinch points. At a match against Nottingham Forest, the wait for a supporter arriving 40 minutes before kick-off was 24 minutes. For matches against PSV and Sunderland, the wait time dropped to 16 minutes.

    The road closure dispute

    The club wants to keep part of Anfield Road closed to motor traffic. This stretch of road runs between Stanley Park and Walton Breck Road via 97th Avenue. It has been closed to vehicles since the construction of the Anfield Road Stand began. Liverpool City Council deferred a decision on the permanent closure.

    Residents and some councillors oppose the move. Councillor Ellie Byrne says the closure forces more traffic onto residential streets. She also notes the impact on disabled and elderly residents who need vehicle access. Ian Byrne, the MP for Liverpool West Derby, also criticized the club’s stance.

    The club argues that a permanent closure creates a safer, pedestrian-friendly space. They also suggest it reduces the risk of terror attacks. The club owns the road.

    Stadium comparison

    Matchday revenue and capacity vary across the Premier League. Liverpool is the fourth-largest club stadium in the league. It follows Old Trafford, the Tottenham Hotspur Stadium, and the London Stadium.

    Club Capacity Category A Price Category B Price
    Tottenham Hotspur 62,850 £70 – £115 £52 – £90
    Liverpool 61,276 £55 – £80 £45 – £55
    Manchester United 74,140 £75 – £95 £55 – £75
    Arsenal 60,704 £80 – £105 £65 – £75

    Manchester United plans a new stadium that will hold 100,000 people. They secured 25 acres of land near Old Trafford in June 2026. Their Wharfside Masterplan was revealed in July 2026. The project will cost around £2 billion.

    Tottenham Hotspur maintains the highest prices for general admission. Their stadium includes an indoor karting facility and dressing rooms larger than those of the home team. They host NFL games and concerts.

    Local infrastructure and future plans

    The club focuses on the wider footprint around Anfield. Billy Hogan, the Liverpool CEO, says the club wants to improve infrastructure and transport. He says the club wants to create reasons for visitors to use the area on non-matchdays.

    Work on the Walton Breck Road highway improvement scheme has started. This project costs £4 million. It aims to create a greener experience for residents and fans. The plan includes wider footpaths and concrete planters. These planters provide a rest area for visitors.

    The scheme also includes a mini-roundabout at the junction of Walton Breck Road, Oakfield Road, and Wylva Street. The project should reach completion in spring 2027. Work remains unfinished.

  • The future of Manchester United’s INEOS era after stadium delay

    The future of Manchester United’s INEOS era after stadium delay

    The ownership split

    The Glazer family holds 69 percent of the voting shares at Manchester United. This majority prevents Sir Jim Ratcliffe from forcing a total sale of the club. Ratcliffe and INEOS hold 28.9 percent of the stake. INEOS manages football operations including transfers and coaching staff. The Glazers retain financial control. This split defines the current era. You likely know the Glazer takeover caused immense debt in 2005, but the new financial pressures stem from different sources. The Glazers hold power.

    Because the Glazer family still holds the majority of the voting shares, they decide whether the club is ever fully sold and Ratcliffe cannot force a sale without their explicit consent or final agreement.

    The stadium delay

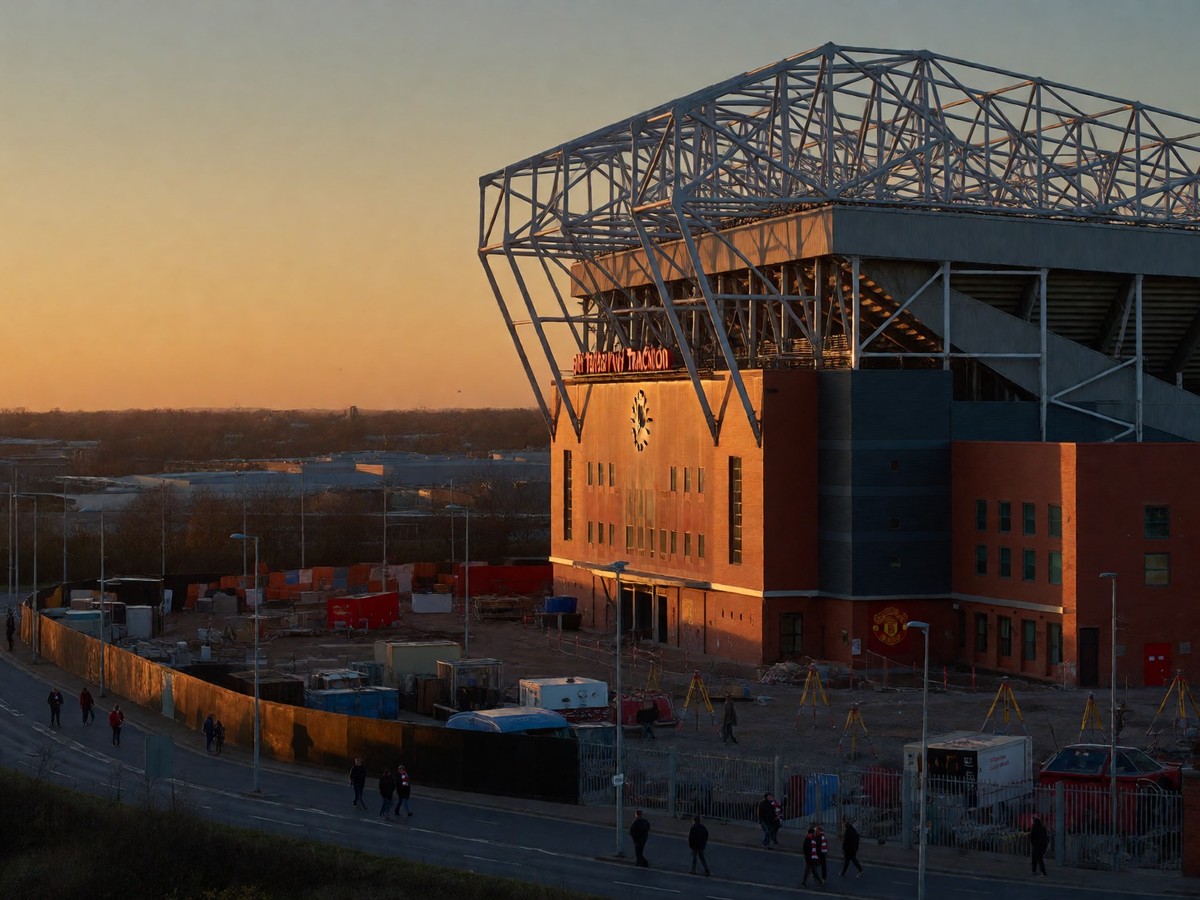
    The New Trafford Stadium project faces a major delay. Negotiating the purchase of land from Freightliner remains the biggest challenge for INEOS. Freightliner might not vacate the land fully until 2031. This timeline falls a year past Ratcliffe’s goal for the 2030/31 season. The project costs £2 billion. A 100,000-seat capacity remains the goal. The design includes three towers and a large canopy. This canopy alone costs £200 million. INEOS may scrap the canopy to save money. The stadium will include the Munich clock.

    The project is the pet project of Sir Jim Ratcliffe. He wants the "Wembley of the North." The project is the Old Trafford Regeneration. The area will see 1.8 million visitors annually. The design uses 35-degree angle stands. These are the steepest stands allowed in the UK. The project will create 92,000 jobs. It will also create 17,000 new homes. The construction will use 160 modular components. These parts will travel up the Manchester Ship Canal.

    Will the land negotiations reach a conclusion before the next fiscal year?

    The transfer revolution

    Michael Carrick leads the squad following his appointment in November 2025. He replaced Erik ten Hag after a poor start to the season. Carrick uses a 4-3-3 formation. This system requires a ball-playing goalkeeper and a deep-lying playmaker. The club prioritizes a defensive midfielder and a wide forward from the right side. INEOS set a net-spend discipline for the summer 2026 window. They allocated £180 million for gross spending and target £45 million from player sales. PSR rules limit the budget.

    The transfer market remains the focus of the INEOS sporting structure. The recruitment team uses data from platforms like FBref to select players. They prioritize players under 26 with resale value. The club seeks to replace aging players with high wages. The club scored only 62 Premier League goals in the 2025/26 season. This was the lowest total since 2015/16. Passing accuracy improved from 82 percent to 87 percent under Carrick.

    The club wants Moises Caicedo from Brighton. They previously failed to sign him. His valuation sits at £75 million. The recruitment team also targets Victor Osimhen. Napoli may negotiate around £85 million. The club wants a left-footed center-back. They submitted a £35 million bid for Leny Yoro. Leny Yoro is 18 years old. The club also watches Noah Sadiki. Sunderland wants at least £45 million for him.

    Player Position Valuation (£M) Priority Probability
    Moises Caicedo CDM 75 High 65%
    Victor Osimhen ST 85 High 45%
    Leny Yoro CB 35 Medium 70%
    Noah Sadiki CDM 45 High 50%
    Alexander Sorloth ST 45 Low 30%

    Squad exits and departures

    The club must sell players to fund new arrivals. The current strategy focuses on moving high earners out of the squad. Harry Maguire is expected to join Newcastle United for £25 million. This move saves the club £190,000 in weekly wages. Anthony Martial is a free agent after his contract expired in June 2026. His departure saves £250,000 in weekly wages. Jadon Sancho faces an uncertain future with Borussia Dortmund. He could command a fee of £35 million. This would save £300,000 in weekly wages.

    Donny van de Beek is moving to Valencia for £18 million. This deal saves £120,000 in weekly wages. The club released Dean Henderson in January 2026. His departure saved £100,000 in weekly wages. The squad is entering a second summer of structural reshaping.

    Player Status Fee (£M) Wage Saved (£k)
    Harry Maguire Newcastle 25 190
    Anthony Martial Free 0 250
    Jadon Sancho Dortmund 35 300
    Donny van de Beek Valencia 18 120
    Dean Henderson Released 0 100

    Financial obstacles

    Manchester United owes £425 million in debt. The club also faces massive interest payments. Existing debts incur annual interest payments of £35 million. The projected wage bill for the 2026/27 season reaches £245 million. PSR rules cap the losses over a three-year cycle. The club must offset spending with income from sales or commercial growth. The stadium project and a full buyout compete for the same cash.

    The club holds a significant amount of debt. The Glazer era left the club with hundreds of millions in borrowing. INEOS has reduced this debt to £425 million. The stadium project is expected to cost £2 billion. Financing this without taxpayer money requires significant capital. The club could use naming rights to help pay the bills. Naming rights could bring in £15 million a year. The club is a public company on the NYSE.

    The growing fan unrest

    The 1958 group organizes protests against the owners. Thousands of fans marched against Ratcliffe and the Glazers before the Fulham match in February. The march included 6,000 supporters. They gathered at Sir Matt Busby Way and the Hotel Football. They target the ownership model. They accuse Ratcliffe of being an incompetent clown. They claim the club is a laughing stock.

    Fans staged protests at the Trinity Statue. They also protested at the Lowry Hotel to stop the team coach. The 2021 pitch invasion is a recent memory of fan anger. Supporters broke into Old Trafford to show their fury. They also targeted the home of Ed Woodward. The Glazer family faces continuous demonstrations. The 1958 group says the ownership model leads to false hope. The club owes billions.

    Ownership scenarios

    Three main scenarios exist for the future. Ratcliffe could buy the Glazers out in stages. The Glazers might tire of holding a minority stake. INEOS could then take full control. This would unify the transfer strategy. This would also set the stadium timeline. A new external buyer might emerge. This buyer would need sovereign or institutional money. A Qatari or Gulf vehicle could return.

    The Premier League rules prevent one party from controlling two clubs in the same competition. This creates a barrier for a Qatari bid because of PSG. Saudi Arabia’s PIF owns Newcastle United. This prevents a straight PIF purchase of Manchester United. American money is a possibility. A tech billionaire or an NFL owner could buy the club. The status quo could continue for years. The Glazers have no financial pressure to sell.

    The status quo holds for now. The Glazers receive value from the holding. The club trades publicly. Ratcliffe may prefer a gradual transition. Buying control first spreads the cost. The stadium project requires stability. Lenders prefer a predictable ownership picture. The debt burden remains a problem. Every season spent outside the Champions League widens the financial gap.

    The collision of goals

    The decision to build a new stadium forces a choice between infrastructure and ownership. The club needs capital for both. The stadium project is the biggest expense. The buyout of the Glazers is also expensive. These two goals compete for the same pool of cash. The Glazers will not sell cheaply. They have priced the club high for years. Ratcliffe faces a difficult financial window.

    The club’s leadership is currently under pressure. The 1958 group says the ownership model is a boomerang. They claim the club faces mismanagement and financial greed. The stadium decision forces capital questions. The club must decide where to put its money. The Glazer family still controls the exit strategy.

  • The future of MicroStrategy’s Bitcoin treasury after the 2026 raise

    The future of MicroStrategy’s Bitcoin treasury after the 2026 raise

    MicroStrategy faces a $13 billion loss. This figure follows a Bitcoin price decline from $126,080 in October 2025 to approximately $58,500 in late June 2026. The company holds 840,447 BTC as of August 16, 2026. These coins have an aggregate purchase price of $63.36 billion. The loss is massive. The company’s market value ties to cryptocurrency fluctuations. The drop in Bitcoin price below support levels exposed the strategy. Analysts call the company the Lehman Brothers of Crypto. The combination of a $13 billion unrealized loss and the impending pressure of multi-billion dollar debt repayments creates a situation where the company must rely on significant Bitcoin price appreciation to remain solvent.

    The Bitcoin Imbalance

    Bitcoin’s 52% decline from the October 2025 peak placed the company’s treasury model under extreme stress. The company reported a $12.5 billion loss in the first quarter of 2026 alone. This decline revealed the leverage within the treasury. The company’s market cap reached $52 billion in early 2026, but its Bitcoin holdings value stood at $42 billion. This difference shows a 24% premium over the net asset value. The company’s strategy depends on Bitcoin appreciation to maintain this premium. If the price of Bitcoin stays low, the company will face liquidity pressures.

    The company also faces extreme shareholder dilution. Class A common shares outstanding grew from 76 million in mid-2020 to 314 million by February 2026. This is a 313% increase. The company uses at-the-market equity offerings to buy Bitcoin. This mechanism trades shares for cash to acquire more coins. The company added more than 258,000 BTC in 2024 through these offerings. This pace of accumulation accelerated the dilution of existing holdings.

    The Capital Accumulation Flywheel

    The company uses a specific cycle to grow its Bitcoin holdings. It issues equity and debt to purchase Bitcoin. This process creates a proprietary metric called BTC Yield. This metric tracks the increase in Bitcoin holdings relative to diluted shares outstanding. The company reported a 9.4% BTC Yield in the first quarter of 2026. This growth in Bitcoin per share helps offset the dilution from new stock issuances. The company uses the software business to provide the operating cash flow. This revenue supports debt interest and corporate infrastructure.

    The software business provides AI-powered tools through the Strategy ONE platform. This segment provides the cash needed to service debt. Software revenue was $123 million in the fourth quarter of 2025. Subscription services grew by 62% year-over-year. However, the software business revenue fails to cover the interest. The total annual payment obligation reaches $1.712 billion.

    Debts reach billions.

    The Convertible Debt Stack

    The company manages its debt through several different layers. It has issued billions in convertible notes with specific maturity dates. These notes are unsecured senior obligations. They do not bear regular interest. They allow investors to convert debt into shares.

    Instrument Principal Amount Maturity Date Interest or Dividend
    0.625% Notes $1.01 billion September 2028 0.625%
    0% Notes $3.0 billion December 2029 0%
    0.625% Notes $800 million March 2030 0.625%
    0% Notes $2.0 billion March 2030 0%
    0.875% Notes $604 million March 2031 0.875%
    2.25% Notes $800 million June 2032 2.25%

    The total convertible debt outstanding is $8.214 billion. The weighted average interest expense is $34.6 million.

    The Put Option Acceleration

    The debt structure includes embedded put options. These options allow noteholders to demand cash if the stock price stays below certain levels. Between September 2027 and June 2028, up to $6.01 billion in put options become exercisable. This happens if the stock price remains low.

    The $1.01 billion September 2028 notes have a put date of September 15, 2027. The $3.0 billion December 2029 notes have a put date of June 1, 2028. The $2.0 billion March 2030 notes have a put date of March 1, 2028. If the stock price is below the conversion price, noteholders will likely demand cash. This could trigger a liquidity crisis.

    Can the company meet the 2027 put demands?

    The Preferred Stock Burden

    The company uses perpetual preferred stock to fund its operations. This financing layer is much larger than the convertible debt. The total size of the preferred stock reached $15.482 billion in June 2026. This is 2.3 times the size of the convertible bonds. The company uses these funds to buy Bitcoin and pay dividends.

    The STRC preferred stock is the largest component. It has an annual dividend of 11.5%. This product has no maturity date. Investors cannot demand principal repayment. The company retains the right to redeem at $101. This creates a permanent financing layer. The STRC dividend alone approaches $1 billion annually. This amount consumes the company’s software cash flow. The company also has other series like STRK, STRF, and STRE. STRF has a 10% cumulative dividend. If the company misses a payment, the rate increases to 18%.

    The company relies on the USD Reserve to pay these dividends. The USD Reserve stood at $4.80 billion as of August 16, 2026. This reserve covers a limited number of months of obligations. If the reserve runs low, the company must sell Bitcoin.

    Volatility remains high.

    Breaking the Promise

    Michael Saylor has a history of long-term Bitcoin conviction. He previously stated he would never sell Bitcoin. This changed in May 2026. The company executed its first-ever Bitcoin liquidation in May 2026. It sold 32 Bitcoins at an average price of $77,135. This sale totaled $2.5 million. The sale was small relative to the total holdings. But the move shattered the narrative of unconditional accumulation.

    The pledge broke.

    The company will sell Bitcoin when it benefits the company. This statement from the CEO indicates a shift in strategy. The company may sell Bitcoin to pay dividends. This signals that the financial health of the company is precarious.

    Competition and the Premium

    The company faces competition from spot Bitcoin ETFs. These ETFs offer Bitcoin exposure without corporate risk. They have lower fees than the implied premium of MicroStrategy. BlackRock’s ETF has $37 billion in assets. Fidelity has over $12 billion in exposure. Investors can buy Bitcoin directly through these products.

    Investors often pay a premium for MicroStrategy stock. This premium comes from the company’s ability to use leverage. The market cap often trades higher than the Bitcoin holdings. In early 2026, the premium was 15% to 25%. However, the premium has compressed. In some periods, the market net asset value slipped to 0.97. This means the stock trades at a discount to the Bitcoin it holds. You should watch the Bitcoin price to understand this premium.

    The Path Toward the 42/42 Plan

    The company’s future depends on the 42/42 Plan. This plan aims to raise $84 billion over two years. The goal is to continue accumulating Bitcoin at an institutional scale. The company uses at-the-market offerings to reach this goal. This involves selling shares to buy Bitcoin.

    The company’s ability to survive depends on two factors. The first factor is the recovery of the crypto market. The second factor is the tolerance of its creditors. If Bitcoin prices rise, the leverage amplifies the gains. If the price falls, the debt becomes a threat. The company’s strategy is a massive risk.

  • How to start NCAA women’s basketball recruiting as a 2026 prospect

    How to start NCAA women’s basketball recruiting as a 2026 prospect

    D1 coaches can initiate personal contact on June 1 after a student-athlete’s sophomore year. This contact includes texts, emails, and direct messages. Coaches can also call athletes. 78 percent of basketball recruits connect with coaches before their junior year. D2 coaches can contact student-athletes at any time. D3 and NAIA teams do not follow the same strict regulations and can contact athletes at any point. Coaches build lists of top prospects by sending questionnaires, evaluating highlight film, and watching recruits compete in person.

    Coaches scout talent.

    The 2026-27 NCAA recruiting calendar

    The NCAA recruiting calendar dictates when coaches can evaluate or contact athletes. A recruiting shutdown means no forms of recruiting are permitted. This includes no contact, no evaluations, no visits, and no phone calls. August 10 through August 16, 2026, is a recruiting shutdown. May 3 through May 8, 2027, is a recruiting shutdown.

    Dead periods restrict in-person contact and evaluations. Communication via phone, email, or social media remains legal during these times. December 24 through December 26, 2026, is a dead period. April 1 through April 5, 2027, is a dead period. April 22 and April 26, 2027, are dead periods for high school and two-year college PSAs only. May 13 and 17, 2027, are dead periods. June 16 and 20, 2027, are dead periods. July 8, 13, 22, and 27, 2027, are dead periods.

    Quiet periods allow in-person meetings on a college campus. Coaches cannot visit a recruit’s home or watch them play in person during these times. August 1 through August 31, 2026, is a quiet period. April 6 through July 31, 2027, is a quiet period.

    Evaluation periods, or live periods, allow coaches to watch players compete in person. Coaches cannot have recruiting conversations with players off the college campus during these stretches. October 1, 2026, to February 28, 2027, is an evaluation period for scholastic activities. April 23 through April 25, 2027, and May 14 through May 16, 2027, are evaluation periods for certified nonscholastic events. July 9 through July 12, 2027, and July 23 through July 28, 2027, are evaluation periods.

    Contact periods allow all forms of communication. September 1 through September 30, 2026, and March 1 through March 31, 2027, are contact periods for seniors and two-year college prospects.

    Grassroots circuit opportunities

    Coaches scout players at grassroots circuit events. These events have different costs and attendance levels. Nike, Under Armour, and Adidas sponsor these evaluation events.

    Circuit Type Gear Cost to Family Coach Attendance Best Fit
    Primary (Nike EYBL, Adidas 3SSB, etc.) Brand-provided Lowest Heaviest D1 Elite prospects
    Secondary (UA Rise, etc.) Family-paid Entry + gear Moderate Mid-major/D2
    Independent (Hoop Group, etc.) Team-owned Most cost-effective Real D2/D3/NAIA

    Primary circuits involve Nike EYBL, Adidas 3SSB, UAA, PUMA Pro16, and New Balance P32. These events have the heaviest high-major Division I attendance. Secondary circuits include EYBL Scholastic, UA Rise, and regional series. These are for players targeting mid-major programs and below. Independent circuits include Hoop Group, NY2LA, and Zero Gravity. These fit players still building their game.

    Digital recruiting platforms

    Recruiting platforms help athletes reach coaches. Some platforms provide human assistance while others focus on data.

    Platform Free Tier Premium Cost Primary Advantage
    RawRecruit Permanent $29.99/mo AI matching
    NCSA Very limited $500 – $4,200/yr Human coaching
    SportsRecruits Yes $99/mo or $399/yr Transparency
    FieldLevel Yes Varies Coach referrals

    NCSA assigns a recruiting coach to help create an individualized plan. This service costs between $500 and $4,200 per year. It provides access to college coach databases and profile hosting. SportsRecruits provides a dashboard to track recruitment progress. It costs $99 per month or $399 per year. It allows athletes to see which coaches view their profiles and videos. FieldLevel works through high school and club coach referrals.

    RawRecruit provides AI matching and direct coach contact. The Varsity tier costs $29.99 per month. This tier includes an AI Advisor, coach phone numbers, and roster analytics. It uses a 5-dimension Fit Score with 135 data points per school. CaptainU provides video hosting and distribution. BeRecruited provides free profiles and basic school searches.

    Which platform provides the best ROI for a five-star prospect?

    Effective communication strategies

    Recruits can call coaches any time if they initiate the contact. Coaches cannot return a voicemail. Athletes should email coaches before they call. Many athletes email coaches to say when they plan to call. High school or club coaches can help set up these times.

    Creating a highlight video is a necessity. Coaches rely on these videos to find interested student-athletes and build lists. A recruiting profile acts like an online resume. It shows athletic skills, academic achievements, and contact information. This profile helps coaches decide if a player fits their team.

    Recruits can use free tools like a coach email generator to draft introductory emails. These emails include the athlete’s grad year and measurables. This ensures the coach knows the athlete when the contact window opens. You should keep your film ready.

    Live evaluation windows

    Evaluation periods, or live periods, allow coaches to watch players compete in person. Coaches cannot have recruiting conversations with players off the college campus during these stretches. Coaches sit in their own sections at these events. They use separate entrances from families. They arrive with a list of recruits they want to see.

    Coaches use these periods to assess playing ability and academic qualifications. Most coaches attend club events in April, May, June, and July. Because high school and college games are often scattered, these periods are when coaches evaluate prospects.

    Athletes should reach out to coaches before a live period occurs. Sending an introductory email with a link to a recruiting profile and highlight film can help secure an evaluation.

    Recruits call coaches.

    Scholarships and verbal offers

    Coaches make verbal offers at any time. These offers are not binding on either side. D1 programs have 15 scholarships per team. This is more than the 13 scholarships available to men’s basketball teams.

    Athletes should ask what could affect their scholarship. Factors include academics, injury, team rules, coaching changes, or other school policies. If a school plans to reduce, cancel, or not renew an athletics scholarship, it must notify the athlete in writing. The school must also provide an opportunity to appeal.

    Evaluating college fit

    Families consider academics, campus life, and cost when searching for schools. They consider school size and campus culture. There are almost 2,000 colleges that offer women’s basketball across NCAA, NAIA, and JUCO programs.

    Recruiting websites can help families find the right fit. Some sites allow athletes to contact current players. Talking to current players helps athletes learn about the reality of college life. This contact helps them find schools that meet both academic and athletic goals.

    Rules limit contact.

  • The defensive identity that secured Arsenal’s Premier League title

    The defensive identity that secured Arsenal’s Premier League title

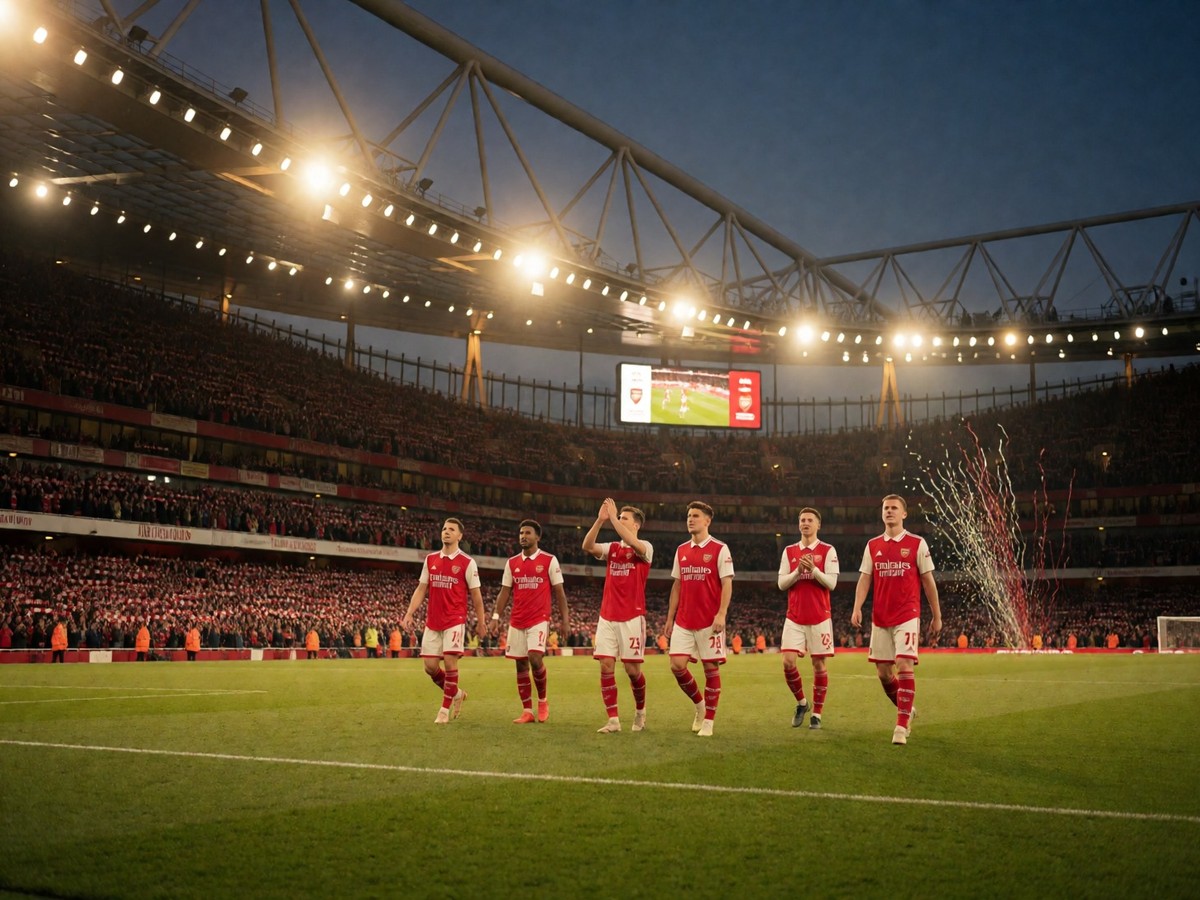
    Arsenal won the 2025/26 Premier League with 85 points. This result ended a 22-year wait for the top flight. The club finished seven points ahead of Manchester City after the Gunners secured victory against Burnley with one game remaining. I believe the trend of defensive concentration at the Emirates decided the race. The team spent 238 days at the top. This is 204 more days than Liverpool. It is 229 more days than Manchester City.

    The title belongs to North London.

    The Emirates Fortress

    The home record at the Emirates provided the foundation for this championship. Arsenal recorded the best home record in the division. They won 15 matches and drew 2. They lost only 2 games at home. The team averaged 2.47 points per game at the Emirates. This stability helped the squad overcome a period of instability in April.

    The consistency of the home performances prevented a collapse. Arsenal won eight games by a score of 1-0. These narrow victories show a professional approach to winning. They did not need high scoring margins to control their results. Instead, they used their structure to stifle opponents. The team ran more distance than their opponents in 35 out of 37 league games. This work rate kept opponents from gaining momentum in North London.

    The Emirates crowd witnessed a side that dominated spatial control. Arsenal’s xG per match reached 1.77. This output remained consistent even during the difficult month of November. The team averaged 1.3 goals per game during that period. They only lost once despite facing low-block opponents and injuries. The home form stayed strong because the defensive structure remained intact.

    David Raya and the Clean Sheet Record

    David Raya won the Golden Glove award for the 2025/26 season. He kept 19 clean sheets in 38 matches. This total tied the record for an Arsenal goalkeeper. He outperformed Manchester City’s Gianluigi Donnarumma, who kept 15 clean sheets. Arsenal conceded only 27 goals in the league. This is eight fewer than the 35 goals conceded by Manchester City.

    David Raya was incredible.

    The goalkeeper provided the stability necessary to turn narrow advantages into points. He kept 19 clean sheets, which was six more than any other team in England, Spain, Italy, Germany, or France. In ten of their seventeen league games, Arsenal allowed chances worth less than 0.5 xG. This level of suppression is rare. The goalkeeper’s ability to claim balls and distribute effectively allowed the team to maintain control.

    The defensive returns were decisive. Arsenal conceded 27 goals in 38 games, which is one of the lowest totals in the modern era. Only Manchester City and Liverpool have conceded fewer goals in recent Premier League seasons. This defensive efficiency is the primary reason the title returned to North London.

    The Saliba and Gabriel Partnership

    William Saliba and Gabriel Magalhaes formed a defensive wall. They started 26 league games together. They won 17 of those games. They kept 15 clean sheets as a pair. They kept a shutout every 1.7 games. This partnership made it difficult for any striker to find space.

    The center-back pairing was effective. Arsenal’s defensive numbers were not just systemic but also delivered at the individual level. When Saliba and Gabriel played together, the team displayed a level of organization that was difficult to break. They conceded only 22 goals in 31 Premier League games. This stat shows how much the team relied on their presence.

    The defensive block compressed the channels between the center-backs and the midfielders. This structure reduced the number of high-quality chances opponents could create inside the box. Opponents often had to take low-value shots from distance. If an opponent tried to counter-attack, they had to beat Gabriel physically first. If they managed that, Saliba covered the space with his pace.

    Set-Piece Efficiency Under Nicolas Jover

    Arsenal became set-piece masters this season. They scored 18 goals from corners. This broke the 33-year-old Premier League record. The previous record of 16 goals stood since the 1992/93 season. They scored 29 goals from set-pieces in total. This is four more goals than any other team in the division.

    Nicolas Jover works on these routines. The majority of the goals came straight from corners. Arsenal’s tall players and smart routines made them difficult to stop. This tactic created a consistent problem for every defense in the league. The goals were spread across the squad. Most goals came from center-backs and midfielders who arrived late into the box.

    The reliance on dead-ball situations provided a way to score when open play was difficult. Arsenal used set pieces to score in 20 different Premier League matches this year. This made them a threat whenever the ball stopped moving. It allowed them to win games where they lacked dominance in possession.

    The Gyokeres Influence

    Viktor Gyokeres cost £69 million. He scored 14 Premier League goals. He scored 21 goals in all competitions. He is the first player to score 20+ in all competitions in a debut Arsenal season since Alexis Sanchez. He creates space for Bukayo Saka and Martin Odegaard.

    Gyokeres is a physical presence. He wrestles with center-backs and keeps them busy. This movement gives Saka and Odegaard breathing room. He averages fewer than two shots per game. This is below the league average for strikers. He does not miss sitters because he is not in those situations often enough.

    He reads the space well. Against Everton, he opened a lane for himself to attack. This created opportunities for teammates. Arsenal are a better attacking team with him on the pitch. They create more chances with him in the lineup. The issue is his connection with teammates rather than his presence.

    Midfield Control With Zubimendi and Rice

    Martin Zubimendi cost £51 million. He allows Declan Rice to play more freely. Rice has an average match rating of 7.32. He played 4,336 minutes. The arrival of Zubimendi transformed the midfield pivot.

    Zubimendi dictates the tempo. He puts his foot on the ball when games become chaotic. He takes care of the dirty work in front of the back four. This allows Rice to drive forward. Rice pops up in the penalty area and bullies midfielders. He is the engine room of the team.

    Martin Odegaard ranks fourth in the league for shot-creating actions per 90 minutes. He is behind Bruno Fernandes, Jeremy Doku, and Rayan Cherki. He beats the first line of pressure and the second line. He recycles possession safely. He finds Saka frequently. He provides a tactical advantage when Arsenal lead.

    Arsenal also signed Noni Madueke for £52 million. He provides depth on the wings. The squad depth helps Arsenal close out tight 1-0 victories. Players like Christian Norgaard and Cristhian Mosquera provide veteran experience.

    Comparing the Defensive Totals

    Arsenal’s defensive dominance was clear when compared to their rivals. They conceded 27 goals. Manchester City conceded 35. This eight-goal gap was where the seven-point title margin was built. Arsenal kept 19 clean sheets. Manchester City kept 16.

    Manchester City were top scorers. They scored 77 goals. Arsenal scored 71. City’s title challenge failed because of inconsistency at the back. Arsenal’s defense was a brick wall.

    Liverpool finished 11th. They conceded 53 goals. They lost 6 of their last 7 matches. Their collapse was comprehensive. They fell from title contenders in September to mid-table in January. They are not the same side they were last year.

    Could this defensive blueprint remain effective in the 2026/27 season?

    The gap between the top two and the rest of the league was wide. Arsenal finished on 85 points. Manchester City finished on 78. Aston Villa finished on 65. Liverpool finished on 60. The defensive reliability of the Gunners was the defining difference.

    The title was built on preventing goals. Arsenal prioritized shot-quality suppression. They forced opponents into low-value attempts. This was more effective than purely focusing on shots per game. The defensive organization was the main driver of success.

  • The Friedkin Group completes Everton takeover

    The Friedkin Group completes Everton takeover

    The Friedkin Group acquired a 98.8% stake in Everton.

    The takeover of the Merseyside club through Roundhouse Capital Holdings Ltd finished after the Premier League and the Financial Conduct Authority granted regulatory approval. Dan Friedkin, the chairman of the Texas-based group, leads the ownership. Marc Watts, the president of the Friedkin Group, serves as the executive chairman and manages the club. This transaction ends the tenure of Farhad Moshiri, who held a 94.1% stake through Blue Heaven Holdings. TFG also owns the Italian Serie A club Roma and the French side AS Cannes. The group possesses annual revenues of £10 billion.

    The deal follows a period of intense negotiation and previous attempts to secure the club. In July, the Friedkin Group withdrew from discussions because of concerns regarding debt and the 777 Partners loan. John Textor, the owner of Crystal Palace, also pursued the club before the Friedkin Group returned to the negotiating table in September. The new owners provided an immediate £200 million to the club. They also took over a £150 million loan from MSP Sports Capital.

    Specification Detail
    Name Hill Dickinson Stadium
    Capacity 52,888
    Location Bramley-Moore Dock, Liverpool
    Primary Contractor Laing O’Rourke
    Estimated Cost £500 million to £750 million
    Design Architects Meis Architects and Pattern Design

    Financial restructuring and debt

    The Friedkin Group is addressing the significant financial burdens left by the previous regime. Moshiri provided approximately £800 million to the club during his ownership, including £450 million in shareholder loans. The club lost £400 million between 2019 and 2023. Last year, the annual deficit reached £89 million. TFG’s takeover includes the conversion of existing short-term debt into equity and long-term senior debt. This change secures the debt against the new stadium and improves the financial standing of the club.

    The club still faces substantial interest obligations. Rights and Media Funding is owed £225 million at an interest rate of 10.25%. TFG also lent £200 million to Moshiri to cover construction costs. A different loan from 777 Partners totals £200 million. The interest on the 777 debt is tied to A-Cap, a New York insurer that holds security on 777’s assets. Leadenhall Capital Partners filed a lawsuit in a New York district court against 777 and A-Cap. The lawsuit alleges fraud and "double-pledging" of assets.

    The debt remains.

    You already know the drama of the takeover.

    The club needs to manage these payments. A-Cap has borrowed money at 18% interest. The club pays RMF an interest rate of five per cent over the base rate.

    The Hill Dickinson Stadium

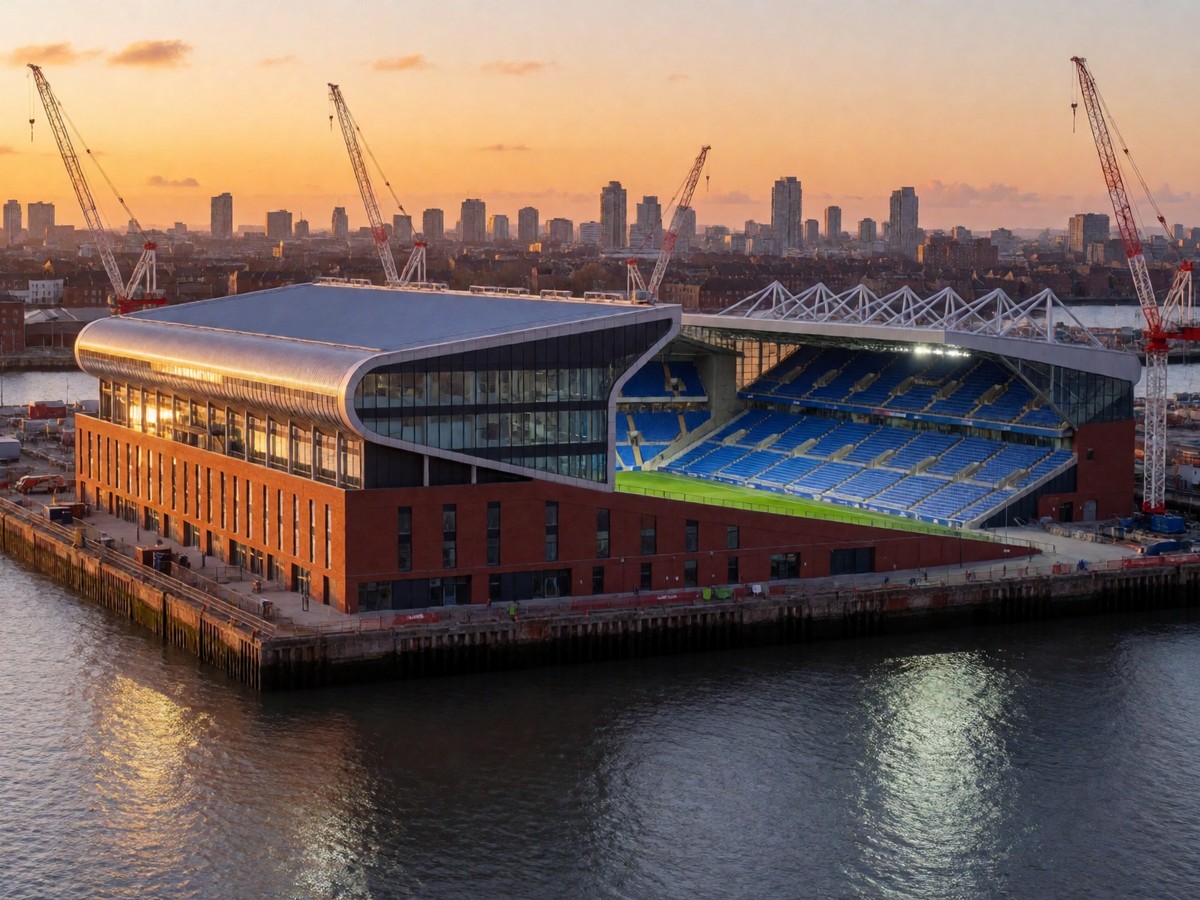
    The new home for Everton is the Hill Dickinson Stadium. This stadium sits at Bramley-Moore Dock. The construction of the new stadium at Bramley-Moore Dock required the filling of the dock basin with 480,000 cubic metres of sand dredged from the bottom of the Irish Sea to create a solid base for the foundations. Laing O’Rourke acted as the main contractor. The stadium reached structural completion in February 2024. The contractor handed the facility over in December 2024.

    The stadium holds 52,888 spectators. This capacity reflects a slight reduction from the original maximum after reviews of seat configuration and media facility requirements. A 13,000-seater stand sits in the stadium and draws inspiration from the "Yellow Wall" at the Westfalenstadion. The facility uses modern technology to help fans. These tools include Self-Service ‘EBars’ and ‘ThroughPass’ technology from Amazon. The stadium also provides the ‘ALL’ experience, which provides social spaces like pubs, bars, and restaurants.

    The club uses a partnership with Seat Unique to sell match-by-match access to lounge seating. This seating includes private TV monitors for replays. The stadium also provides a way for fans to leave a mark via The Dock Lines. This installation contains 36,000 personalised granite stones. Fans buy these stones for between £49 and £499. The installation sits on the Budweiser Fan Plaza.

    Moving from Goodison Park

    Everton is moving away from Goodison Park. The club occupied Goodison Park for nearly 134 years. The stadium had a capacity of 39,414. In 1990, the Taylor Report forced the stadium to become all-seater, which reduced the capacity from a peak of over 78,000. The club considered moving in 1996, but plans for a 60,000-seater stadium failed. In 2001, the club identified King’s Dock as a site, but funding issues stopped the project. The Kirkby project, which involved a 55,000-seat stadium, received rejection from the central government following a public inquiry.

    The club also looked at Stanley Park in 2012, but that plan was cancelled. In 2017, Bill Kenwright named Bramley-Moore Dock as the preferred site. The club agreed to a 200-year lease with Peel Holdings in 2017. This lease allows for a 40-year sub-lease to the club. The development caused UNESCO to remove Liverpool from its list of World Heritage Sites in 2021. UNESCO stated the stadium had a major adverse impact on the authenticity of the site.

    The transition is underway.

    Matchday experiences and events

    The stadium acts as a venue for more than football. In August 26, 2026, the stadium hosts a drive-in cinema event. This event, titled "Movies on the Mersey," screens films like Finding Nemo and Back to the Future. Tickets for the weekend cost £30 per vehicle. The stadium also hosts golf experiences. In July 2026, the club worked with Upper Deck Golf to host an interactive driving range. This event coincided with the Open Championship at Royal Birkdale.

    The venue hosts international rugby too. Fiji Rugby planned a match against England at the stadium in July 2026. The fanzones for this match include traditional Fijian food and music. The stadium also attracts interest from the Women’s World Cup in 2035. The club aims to host various events to generate revenue throughout the year.

    The club faces debt.

    Footballing results and transfers

    The 2025-26 football season concluded with Everton finishing in 13th place in the Premier League. The team earned 49 points. Highlights included a 3-0 home win against Chelsea and away victories against Manchester United and Aston Villa. The club sold Amadou Onana to Aston Villa for £50 million. The club also sold Lewis Dobbin and Ben Godfrey. The club refused a £45 million offer for Jarrad Branthwaite.

    The women’s team played at the Hill Dickinson Stadium. They finished 8th in the Women’s Super League with 23 points. They secured a 4-1 win against Liverpool at Anfield. The women’s team also played their first match at the new stadium against Manchester United in October 2025.

    Seamus Coleman retired after 17 years at the club. He made 434 appearances for the team. The club continues to invest in its Academy system.

    The 777 debt complication

    The legal issues surrounding 777 Partners create a difficult environment for the new owners. A-Cap holds control of 777’s assets. Leadenhall Capital Partners is suing both 777 and A-Cap in New York. Leadenhall claims 777 engaged in fraud through "double-pledging" assets. This involves using the same collateral for multiple loans.

    The legal battle creates uncertainty for any potential buyer. If the US Department of Justice files criminal charges, it could create a Proceeds of Crime Act issue. TFG discussed indemnity insurance with Moshiri’s lawyers, but Moshiri declined. The interest rates on the debt remain high. A-Cap borrows money at 18% interest. This makes servicing the debt expensive for the club.

    Will the club manage the high interest rates?

    Historical stadium comparisons

    Goodison Park stood in a different environment than the new dockside location. Goodison Park sat next to Victorian terraced housing. The new stadium is a massive steel and glass structure. The capacity at Goodison was limited by its location and construction methods. The new site at Bramley-Moore Dock uses reclaimed sand from the River Mersey to fill the basin.

    The stadium design uses a mix of red brick and steel. The upper parts use metal and glass. The lower part uses a brick facade. This design attempts to blend with the industrial character of the area. The club uses the names Hill Dickinson Stadium to identify the venue. The club has now moved.

    The club faces debt.

    The takeover is complete.

  • How Monza’s 2026 sprint format is changing tire strategy

    How Monza’s 2026 sprint format is changing tire strategy

    Pirelli removed the C6 compound from the 2026 dry-tire roster.

    Because the performance difference between the C5 and the C6 prototypes offered no significant advantage, Pirelli decided to drop the C6 compound from the 2026 dry-tire roster entirely. Testing with mule cars following the 2025 Mexico Grand Prix showed that the performance gap between the C5 and the C6 prototypes was too small to justify the extra tire. The FIA approved this decision to limit the available dry compounds to five: C1, C2, C3, C4, and C5. This change follows tire development that concluded on September 1, 2025.

    New tire dimensions and specifications

    The 2026 regulations change the physical dimensions of the tires. Front tires measure 25mm narrower than the current versions. Rear tires measure 30mm narrower than the current versions. These adjustments accommodate the move to 18-inch wheels.

    Specification Dimension Change
    Front Tires 25mm narrower
    Rear Tires 30mm narrower
    Total Dry Compounds 5 (C1 to C5)

    Teams must adapt their race weekend setups to these new measurements. The reduction in tire range means that qualifying and race simulations must adjust to different wear rates.

    The 2026 Sprint calendar

    The 2026 season includes six Sprint weekends. These events are spread across the calendar to provide additional racing.

    Date Grand Prix
    March 13-15 China (Shanghai)
    May 1-3 USA (Miami)
    May 22-24 Canada (Montreal)
    July 3-5 Great Britain (Silverstone)
    August 21-23 Netherlands (Zandvoort)
    October 9-11 Singapore (Marina Bay)

    The Sprint format provides a shorter version of the Grand Prix. The race covers 100km, which is about one-third of a standard Grand Prix distance. The race lasts approximately 30 minutes. There are no mandatory pit stops during the Sprint.

    The Sprint awards points to the top eight finishers. These points count toward the Drivers’ and Constructors’ World Championship standings.

    Position Grand Prix Points Sprint Points
    1st 25 8
    2nd 18 7
    3rd 15 6
    4th 12 5
    5th 10 4
    6th 8 3
    7th 6 2
    8th 4 1
    9th 2 0
    10th 1 0

    Sprint Qualifying and tire requirements

    Sprint Qualifying uses a three-part format. The segments last 12 minutes for SQ1, 10 minutes for SQ2, and 8 minutes for SQ3. Seven-minute intervals separate each section. The six slowest drivers exit SQ1 and SQ2. The top 10 drivers enter SQ3 to compete for Sprint Pole. Teams use Medium tires for SQ1 and SQ2. They use Soft tires for SQ3. You must recognize that the single practice session forces teams to make decisions immediately. Because there is no time for multiple runs or tire changes, fresh rubber is mandatory for each segment.

    The Sprint results do not affect the starting grid for Sunday’s Grand Prix. Qualifying on Saturday afternoon determines the Sunday grid.

    Parc ferme and car setup

    Parc ferme rules change the way teams handle car setups. Cars enter parc ferme at the start of Sprint Qualifying and remain under these conditions until the end of the Sprint. Teams can make further changes to the MCL40 between the Sprint and the start of Grand Prix Qualifying. After the start of Qualifying, the cars enter parc ferme for the final time. This provides more flexibility to change setups for the Sprint and the Grand Prix.

    A single 60-minute Free Practice session occurs on Friday. This leaves teams with very little time to test parts and settings for both the Sprint and the Grand Prix.

    Monza strategy and the medium-soft shift

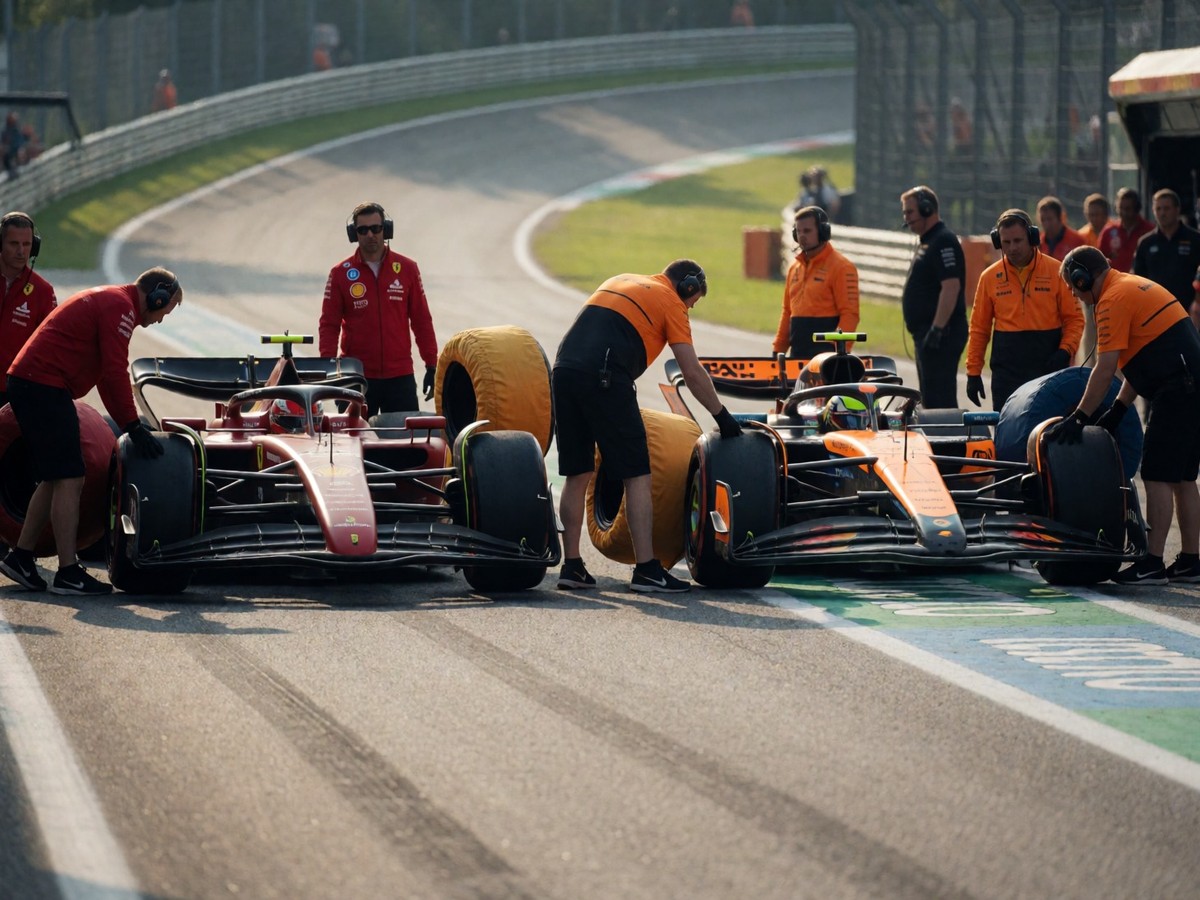
    Monza presents a major strategic challenge because of the pit lane. A pit stop results in a 21-second time loss. Drivers travel through the pit lane at 80kph. This makes a one-stop strategy the main target for all teams.

    The Sprint changed the expected tire combination for the Grand Prix. Earlier in the weekend, starting on Mediums and switching to Hards seemed like the safest bet. However, the Soft tire performance in the Sprint changed this outlook. McLaren, Alpine, and Aston Martin all used the Soft tire in the Sprint and experienced no degradation issues. This performance makes a Medium-Soft strategy an attractive alternative.

    Drivers must reach at least lap 30 on the Medium tires to make the switch to Softs. If a driver needs to pit before lap 30, they might choose the Hard compound instead. Will the Medium-Soft strategy provide enough of a gap for the frontrunners?

    McLaren and Mercedes tactics

    McLaren performed well in the 2025 Sprint races. Lando Norris won the Sprints in Miami and Sao Paulo. Oscar Piastri won the Sprint in Qatar. The Soft tire durability seen in the Sprint provides useful information for the race.

    2025 Sprint Event Lando Norris Result Oscar Piastri Result
    China 4th 6th
    Miami 1st 2nd
    Canada 2nd 4th
    Great Britain 3rd 7th
    Sao Paulo 1st N/A
    Qatar N/A 1st

    Mercedes might use a different approach for Valtteri Bottas. Bottas starts from the back of the grid after the Sprint. He could drive an attacking first stint on the Soft compound. He would then pit for Hards in clear air at the back of the field. This strategy provides data for Lewis Hamilton’s second stint.

    Other teams might try different starting compounds to find an advantage. At Silverstone, only Sergio Perez opted for a different compound by starting on Hards from the pit lane. Most of the field started on Mediums.

    Temperature and blistering risks

    The weather at Monza affects tire longevity. Air temperatures reach 30C on Sunday afternoon. Track temperatures will exceed 30C. Low downforce levels cause the cars to slide more. This sliding increases surface temperatures on the tires. This increase can lead to blistering.

    The heat helps with warm-up for the harder compounds. However, the sliding caused by low downforce remains the main area for concern. Teams must monitor the rear tires to prevent overheating.

    The Sprint awards points.

    The C6 is gone.

    The heat remains a threat to those using the softer compounds.

  • July unemployment rate and the Sahm Rule recession signal

    July unemployment rate and the Sahm Rule recession signal

    The unemployment rate rose to 4.3% in July, up from 4.1% in June. This jump marks the highest unemployment level in nearly three years. The Sahm Rule reading for this period is 0.53%, which is an increase from the 0.43% reading in June. While the 4.3% figure is still historically low, the speed of the increase has caused concern. I see these numbers as a signal that the labor market is softening.

    The mechanics of the Sahm Rule

    The Sahm Rule tracks the three-month moving average of the national unemployment rate. It compares this moving average to the lowest three-month moving average from the previous 12 months. A recession becomes likely when this difference is 0.50 percentage points or more. In July, the three-month average unemployment rate was 4.30. This is 0.13% above its low for the previous 12 months according to some data. Another calculation shows the 4.3% rate is more than a half point above the 3.6% average from one year ago. The Bureau of Labor Statistics (BLS) publishes this data. They collect information through the Current Population Survey (CPS), which interviews households, and the Current Employment Statistics (CES) survey, which gathers information from employers. The Sahm Rule uses only this single data series. This simplicity makes it a popular tool for identifying downturns. Since 1950, the rule has signaled every one of the 11 recessions. It typically signals a recession about three months after it starts. The rule has only one false positive in its history. That false positive occurred in 1959. Even then, the US entered a recession six months later.

    The Bureau of Labor Statistics (BLS) publishes the monthly unemployment rate. This data comes from the Current Population Survey (CPS), which interviews households, and the Current Employment Statistics (CES) survey, which gathers information from employers. The rate shows the percentage of the total labor force that is unemployed but actively seeking employment and willing to work. The BLS is a unit of the United States Department of Labor. This monthly report is part of the broader Employment Situation Summary.

    Market volatility and economic fear

    The rising jobless numbers caused immediate turmoil in the stock market. The Dow Jones Industrial Average fell 363 points, or 1.5%, on Friday. The S&P 500 index dropped 1.4%, though one source says it fell 1.8%. The Nasdaq Composite fell 2.4%. Investors fear a 4.4% unemployment rate could signal even more weakness. The rise in unemployment suggests a flagging job market. This decline in stocks happened because of fears regarding a soft landing. A soft landing is when the Federal Reserve lowers inflation without causing a recession. Sarah House, an economist at Wells Fargo, says the rising unemployment rate raises concerns about this possibility.

    Labor supply and immigration factors

    The increase in unemployment does not only come from layoffs. The labor force grew by 420,000 workers in July. This increase in the pool of people looking for work can push the unemployment rate higher. Ryan Sweet, the chief U.S. economist at Oxford Economics, says many people left the workforce during the pandemic for health or family reasons. Others returned because of rising wages. Immigration also influenced these numbers. RBC Capital Markets estimates that immigrants filled about one third of the 3 million jobs added in 2023. Goldman Sachs notes that new immigrants often have more difficulty finding work during their first few years in the country. This difficulty can push the unemployment rate higher. The pandemic also created mismatches between jobs and workers. Many workers had to retrain for different industries after the pandemic. Consumer demand shifted from goods back to services, which changed the types of workers needed.

    While the Sahm Rule indicates a recessionary environment by comparing the three-month average unemployment rate to the prior year’s low, the influx of new workers and immigrants complicates the reliability of this specific signal.

    Why the rule may not apply

    Many economists argue the Sahm Rule might not apply this time. They believe the pandemic-era labor disruptions make the rule less reliable. Although unemployment insurance claims have reached their highest levels in more than a year, they remain historically low. This is because employers have been reluctant to cut staff after the COVID-related labor shortages. The economy has been unusually defiant. Gross domestic product has continued to grow. Consumer spending and business investment remain resilient. Household income is also growing. I find the combination of a Sahm Rule trigger and growing consumer spending to be the most important contradiction in the current data.

    Economic Metric July 2026 Data
    Unemployment Rate 4.3%
    June Unemployment Rate 4.1%
    Three-Month Average 4.30%
    12-Month Low Average 3.6%
    Sahm Rule Value 0.53%
    Sahm Rule Threshold 0.50%
    Fed Funds Rate 5.25% to 5.5%
    Inflation Rate ~3%
    2023 Job Additions 3 million
    New Labor Force Entrants 420,000

    The Federal Reserve and interest rates

    The Federal Reserve must manage both inflation and employment. Inflation is around 3%, which is much lower than the 9.1% peak in 2022. However, this is still above the 2% goal of the Fed. Interest rates have stayed between 5.25% and 5.5% since last summer. Jerome Powell, the Fed Chair, says the labor market is normalizing. He is watching to see if the market shows signs of a sharper downturn. Rick Rieder, the chief investment officer at BlackRock, says a September rate cut is almost a given. He believes the current interest rate is too restrictive because inflation is trending lower and labor force slack is building. Elyse Ausenbaugh, the head of investment strategy at J.P. Morgan Wealth Management, says the Fed may have fallen behind the curve.

    The rising unemployment rate reflects a growing number of people looking for work. These include Americans who left during the pandemic to care for children or for health reasons. Others were drawn into the job market by robust wage growth. The job market is feeling these effects. Hiring has dipped well below pre-pandemic levels. The number of people quitting jobs tumbled to 3.3 million in June, which was the lowest level since 2020.

    Assessing the recession risk

    The Sahm Rule is a powerful tool, but it is not a crystal ball. Claudia Sahm, the economist who created the rule, says a recession is not imminent. She says the volume on the Sahm Rule is probably turned up a little too loud right now. She notes that the swing from labor shortages to immigration can magnify the unemployment rate. She also believes the Fed should focus on the second part of its mandate: maximum employment. The labor market is showing real softening. If layoffs continue to edge up while hiring lags, it could push the unemployment rate higher and lead to a recession.

    The jobless rate rose.

    Recession is not imminent.

    Will the Federal Reserve decide to implement a 50-basis-point rate cut in September?