Blog

  • The statistical profile of Real Madrid’s perimeter game

    The statistical profile of Real Madrid’s perimeter game

    Real Madrid produces 10.0 three-point makes per game. This volume helps the team maintain a +5.1 point differential across 44 games. The squad attempts 26.6 three-pointers every game. This frequency results in a 37.7 percent shooting accuracy. The offense remains balanced because four players average double digits.

    The numbers show a shift.

    The statistical profile of Real Madrid's perimeter game (2)

    The 2025-26 season statistics for Real Madrid include 88.1 total points scored and 83.0 points allowed. The team holds a 549.8 total rebound count. They record 19.2 assists and 12.3 turnovers. Defensive pressure results in 3.9 blocks per game. The team also incurs 20.2 personal fouls per game. This high foul rate limits the team’s perimeter control. You should observe how the 3-point shooting frequency shifts the rebounding landscape.

    Long-term shooting trends in professional basketball

    The Montenegrin Journal of Sports Science and Medicine notes that EuroLeague exhibited a higher reliance on three-point shooting with a greater three-point attempt rate and more three-point attempts per 100 possessions than the NBA. This distinction remains a constant in tactical planning. EuroLeague teams also outperformed the NBA in three-point makes and effective field goal percentage. The NBA shows a steeper upward trend in shooting efficiency in recent seasons. The NBA maintains a higher rate of two-point field goal attempts per 100 possessions.

    The NBA also features different scoring distributions. Golden State attempted 43.9 three-pointers per game in 2025. Charlotte attempted 43.5. Boston attempted 42.5. Portland attempted 42.1. Phoenix attempted 40.6. Chicago attempted 40.1. Memphis attempted 39.5. Cleveland attempted 39.5. Atlanta attempted 39.3. Milwaukee attempted 39.1. Brooklyn attempted 38.4. Miami attempted 37.9. Oklahoma City attempted 37.8. Indiana attempted 37.6. San Antonio attempted 37.4. New York attempted 37.4. Utah attempted 36.7. Minnesota attempted 36.4. Washington attempted 36.4. Denver attempted 35.5. Philadelphia attempted 35.0. Orlando attempted 34.0. LA Clippers attempted 33.8. LA Lakers attempted 32.3. New Orleans attempted 32.1. Toronto attempted 31.9. Dallas attempted 31.9. Houston attempted 31.6. Detroit attempted 30.8. Sacramento attempted 30.2.

    Offensive efficiency and roster construction

    Real Madrid relies on a spread scoring model. Theo Maledon averages 11.7 points in his debut EuroLeague season. Facundo Campazzo averages 12.1 points. Trey Lyles averaged 14 points. Mario Hezonja averaged 12.5 points. The team lost Hezonja and Lyles during the summer transfer market. The squad added Mikael Jantunen, Eli Ndiaye, and Olivier Sarr. Jantunen is 26 years old and weighs 100 kg. Ndiaye is 22 years old and weighs 95 kg. Sarr is 27 years old and weighs 109 kg.

    The roster contains several veteran players. Sergio Llull is 38 years old and weighs 94 kg. Edy Tavares is 34 years old and weighs 125 kg. Damian Jones is 31 years old and weighs 111 kg. Gabriel Deck is 31 years old and weighs 105 kg. Alberto Abalde is 30 years old and weighs 95 kg. Timothe Luwawu-Cabarrot is 31 years old and weighs 98 kg. Chuma Okeke is 28 years old and weighs 104 kg.

    Will the departure of Mario Hezonja diminish the scoring depth of this perimeter-heavy offense?

    Rebounding dynamics and three-point volume

    Three-point shots create more long rebounds than two-point attempts. Paris Basketball uses a "tagging up" strategy to exploit this trend. This strategy involves all five offensive players going to the high side of their matchup during a shot attempt. Paris Basketball takes the most three-pointers per game in the EuroLeague. This volume allows them to secure 39.9 percent of offensive rebounds. They lead the league with 12.6 offensive rebounds per game.

    Madrid maintains a different statistical profile. The team records 11.9 offensive rebounds and 25.8 defensive rebounds. This total results in 37.7 total rebounds per game. The team relies on Edy Tavares, who is 2.20 m tall, to anchor the presence near the rim. Usman Garuba is 2.03 m tall and weighs 115 kg. Jaime Pradilla is 2.05 m tall and weighs 106 kg.

    Tactical execution through after timeout plays

    Coaches use after timeout plays to create scoring opportunities. These plays exploit defensive vulnerabilities. Barcelona uses the "Barcelona Chin to Back Screen" play. In this set, player 1 passes to player 4. Player 4 executes a dribble handoff with player 1. Player 1 cuts to the paint and sets a back screen for player 5. This movement creates space for player 3 on the left wing.

    Effective execution requires communication. Players must understand their roles in these sets. Success depends on precise movements. Madrid also faces opponents like Barcelona, who use specific offensive sets to create space. Madrid won the last three EuroLeague Clasicos since November 28, 2024. These scores were 90-97, 96-91, and 92-101. The overall European record in Madrid favors the home side 21-18.

    Player profiles in the perimeter rotation

    The Madrid rotation includes specific shooters. Max Shulga is 24 years old and weighs 95 kg. Gabriele Procida is 24 years old and weighs 88 kg. Both players provide options for the perimeter. Facundo Campazzo is 35 years old and weighs 84 kg. He leads the backcourt in scoring frequency.

    The bench provides depth. Mikael Jantunen is 26 years old. Eli Ndiaye is 22 years old. Olivier Sarr is 27 years old. These players support the starters. The team relies on the experience of Sergio Llull, who has scored 11,515 points in his career. Llull has played in 1,084 matches.

    Player Position Age Height Weight
    Facundo Campazzo PG 35 1.78 m 84 kg
    Theo Maledon PG 25 1.93 m 79 kg
    Sergio Llull SG/PG 38 1.90 m 94 kg
    Gabriel Deck PF/SF 31 1.98 m 105 kg
    Edy Tavares C 34 2.20 m 125 kg
    Jaime Pradilla PF/C 25 2.05 m 106 kg
    Chuma Okeke PF/SF 28 2.01 m 104 kg
    Alberto Abalde SF/SG 30 2.02 m 95 kg

    Comparative efficiency of Madrid’s shooting

    Madrid’s shooting metrics show high efficiency. The team hits 56.0 percent of its two-point field goals. This comes from 37.1 two-point attempts per game. Their three-point shooting hits 37.7 percent. This efficiency is a result of 26.6 three-point attempts. The team also converts 78.9 percent of its free throws. This total comes from 20.8 free throw attempts per game.

    I find the team’s perimeter dependency too high. The squad scores 88.1 points while opponents score 83.0. This margin relies on the ability to convert long rebounds. Madrid also has 19.2 assists per game. This passing supports the perimeter rotation.

    The scoring is even.

    Context of the European basketball market

    The 2026 transfer market is intensifying. Dubai Basketball signed Toko Shengelia from Barcelona. Dubai also signed Mamadi Diakite and Davion Mintz. Xavi Pascual is the head coach for Dubai. The EuroLeague rosters include many changes.

    Fenerbahce Beko Istanbul signed Shavon Shields and Will Clyburn. Zalgiris Kaunas signed Jonas Valanciunas and Marius Grigonis. Maccabi Rapyd Tel Aviv remains a competitive force. Olympiacos Piraeus signed Codi Miller-McIntyre and Evan Fournier.

    Madrid maintains its position through veteran stability. Sergio Llull remains the captain. The team remains a consistent force in the EuroLeague standings. They have 11 EuroLeague titles. These titles include seasons from 1963-64 to 2022-23. The team also holds 38 Spanish League titles.

    Madrid hits shots. The stats stay. They win games.

  • Common mistakes with yen carry trades after BOJ policy shifts

    Common mistakes with yen carry trades after BOJ policy shifts

    The Bank of Japan raised its benchmark interest rate by 25 basis points to 0.75% on Friday. Governor Kazuo Ueda stated that the bank must act pre-emptively to avoid the risk of being forced to abandon yield curve control against its will. This decision follows a July move where the bank increased the overnight rate to 0.25%. The central bank also expanded its tolerance for 10-year Japanese government bond yields. It now allows these yields to fluctuate in a range of plus and minus 0.5 percentage points from the 0% target. The bank will also offer to purchase 10-year bonds at 1% through fixed-rate operations. The bank raised its median inflation forecast for fiscal 2023 to 2.5% from the 1.8% prediction from April. This policy shift tightens monetary policy while the US Federal Reserve approaches a rate-cutting cycle.

    The expansion of the yield target range targets the sustainability of the current framework. Ueda noted that the bond market remains stable and that the timing for these tweaks was appropriate. He also mentioned that if inflation expectations heighten, the bank might struggle to control bond yields with market operations. This could lead to falling real interest rates and further inflation. The bank decided to make the yield curve control flexible to balance these side effects. Recent data shows that inflation has exceeded the 2% target for 15 straight months. Wages are also starting to increase after years of stagnation.

    Common mistakes with yen carry trades after BOJ policy shifts (2)

    The mechanics of the yen carry trade

    You already know how a carry trade works. Investors borrow money in a currency with low interest rates to buy assets with higher returns. The difference between these rates provides the carry, which is the expected return. In the recent past, the Japanese yen served as an ideal funding currency because interest rates remained extremely low. In July 2024, Japanese interest rates sat between 0% and 0.1%. This made borrowing yen very cheap for global investors.

    Traders took this cheap yen and exchanged it for US dollars. They then invested those dollars into higher-yielding assets like US stocks. The S&P 500 rose over 16% from the start of 2024 to the end of July. Because the yen weakened significantly against the dollar during this time, investors also gained from the exchange rate move. From the end of 2023 to June 2024, the yen weakened against the US dollar by over 14%. This provided an extra layer of profit for those holding US assets.

    The math changes when interest rate differentials narrow. If Japanese interest rates rise, the cost of repaying the borrowed yen increases. This can erase the profits from the interest rate spread. When the spread dwindles, investors exit their positions to avoid losses. This exit process is called unwinding the carry trade. Morgan Stanley estimates that $500 billion in outstanding yen carry positions still exist in the market.

    Interest rate divergence and the narrowing spread

    The primary driver of carry trade viability is the interest rate spread between Japan and the United States. The Bank of Japan is moving toward a sustained tightening cycle. In contrast, the US Federal Reserve is entering a rate-cutting cycle. This divergence implies a gradual narrowing of the interest rate spread. If Japan tightens faster than expected while the US cuts rates sharply, the spread could compress rapidly. This compression undermines the profitability of the trade and increases unwinding pressure.

    The US economic data also influences this spread. In August 2024, the US employment report showed that the economy created 114,000 jobs. This fell short of the 179,000 jobs the market expected. Such a shortfall suggests a slowing US economy, which increases the likelihood of Federal Reserve rate cuts. When the Fed cuts rates, the US dollar often weakens. A weaker dollar makes it less attractive to hold US-denomely assets.

    The yen moves quickly.

    As the yen appreciates, investors who borrowed in yen find it more expensive to repay their loans. This increases the pressure on those still holding the position. A significant dollar depreciation prompts investors to reassess portfolio allocations. They may sell US assets to repatriate yen positions. This process strengthens the yen and accelerates the unwind.

    Technology stocks as the liquidity exit

    The yen carry trade functions as a form of global leverage. Large investors use borrowed yen to fund positions in high-yielding economies. This leverage often sits underneath the Nasdaq 100. Because the borrowed money helps finance richly valued technology shares, a sudden reversal in the yen can pull equities lower. This happens even if nothing changed in the companies themselves.

    High-flying technology stocks are among the easiest positions to sell. When the yen strengthens and the trade turns against holders, investors must raise cash quickly. They target the most liquid and most valued names first. This can lead to a deleveraging wave across US equities. The correlation between the USD/JPY exchange rate and the Nasdaq 100 has historically been positive.

    Asset Ticker Price Change % Volume
    NVDA +1.48% 124.70M
    TSLA +5.51% 61.73M
    MSFT -1.22% 507.29M
    AAPL -0.89% 41.24M
    AMZN -2.50% 46.09M

    The volatility in tech stocks can spike when the yen moves. In past unwinds, the yen strength coincided with a spike in the VIX volatility index. Investors often sell these positions to cover their losses.

    The margin call trap

    Unwinding carry trades often triggers margin calls. A margin call happens when a trade’s value falls below a required level. This forces the investor to add funds or sell assets to cover losses. Because carry trades use borrowed money, leverage amplifies the impact of market moves. The Nikkei index fell 12.4% on August 4, 2024, during a major unwinding event. This was the worst decline for the index since 1987.

    The Nikkei’s 12.4% single-day plunge in August 2024 was a massive disaster for investors. This volatility in Japanese equities spilled over into global markets. The S&P 500 also dropped 3% that same day. This represents the worst one-day loss for the index in nearly two years.

    The spread narrows.

    When the yen rises, it creates a cycle of selling. Buying yen to close out a loss-making trade drives the yen higher. This higher yen increases the pressure on those still holding the position. This can lead to a synchronized unwinding because many trades have a homogeneous structure. Price adjustments tend to be abrupt because these trades lack buffering mechanisms.

    Currency repatriation and exporter pressure

    A strengthening yen threatens the profitability of Japanese exporters. Companies like Toyota and Sony sell products in dollars and repatriate their profits in yen. When the yen is strong, their earnings in yen terms decrease. The tumbling market in Tokyo can unleash a spiral.

    The yen rise also affects Japanese banks. While Japanese bank shares rallied 5.3% following the recent BOJ announcement, they previously faced pressure. During the August unwind, Japanese bank shares fell by 27% in two trading days. Investors fear that lower interest rates in the US will reduce the profits of banks that lend in dollars.

    Japanese investors also hold massive amounts of foreign assets. They owned $10.6 trillion in foreign assets at the end of last year. Many of these holdings are unhedged. If the yen trend has fundamentally shifted, these investors might sell US bonds in favor of Japanese bonds. This would increase the supply of US Treasuries and push US yields higher.

    Monitoring the unwind risk

    Traders use several indicators to assess the risk of a carry trade unwind. The interest rate spread between the US and Japan is the core measure of attractiveness. The level of the JPY exchange rate also matters. A move toward or beyond 160 yen per dollar may indicate excessive short positioning. Finally, market volatility in the VIX provides a signal of risk.

    Indicator Current/Recent Value
    JGB 10-year Yield 1.95%
    Projected JGB 10-year Yield 2.25%
    US Fed Rate Expectation Cutting Cycle
    Nikkei 225 (Aug 4 move) -12.4%
    US Jobs Growth (July) 114,000
    VIX Level 17

    Because the yen strengthened rapidly in late July 2024, investors who had borrowed in yen found it more expensive to repay their loans, which triggered margin calls and forced a rapid unwinding of positions.

    The reality of the market shift

    The US Treasury market serves as a leading indicator for carry trade risk. Rapid declines in yields often reflect expectations of an economic slowdown. This signals narrowing interest rate differentials. However, US Treasury yields have remained relatively flat since mid-2023. Since early 2024, rates have stayed within a range of 3.8% to 4.7%. Even as Japanese yields rose from 1.6% to 2.4%, US rates did not spike.

    This suggests that much of the carry trade has already dissipated. Many investors have already moved out of their positions. The market is in a sensitive phase. The direction of the US dollar also remains important. The dollar has stayed relatively steady since July despite rising Japanese interest rates. The dollar remains 4% above its 40-year average.

    Will the Bank of Japan manage to avoid a sudden, uncontrolled abandonment of yield curve control? I think the carry trade unwind is far from over because the interest rate spread will keep narrowing.

  • Understanding Ethereum ETF staking yields and fee structures

    Understanding Ethereum ETF staking yields and fee structures

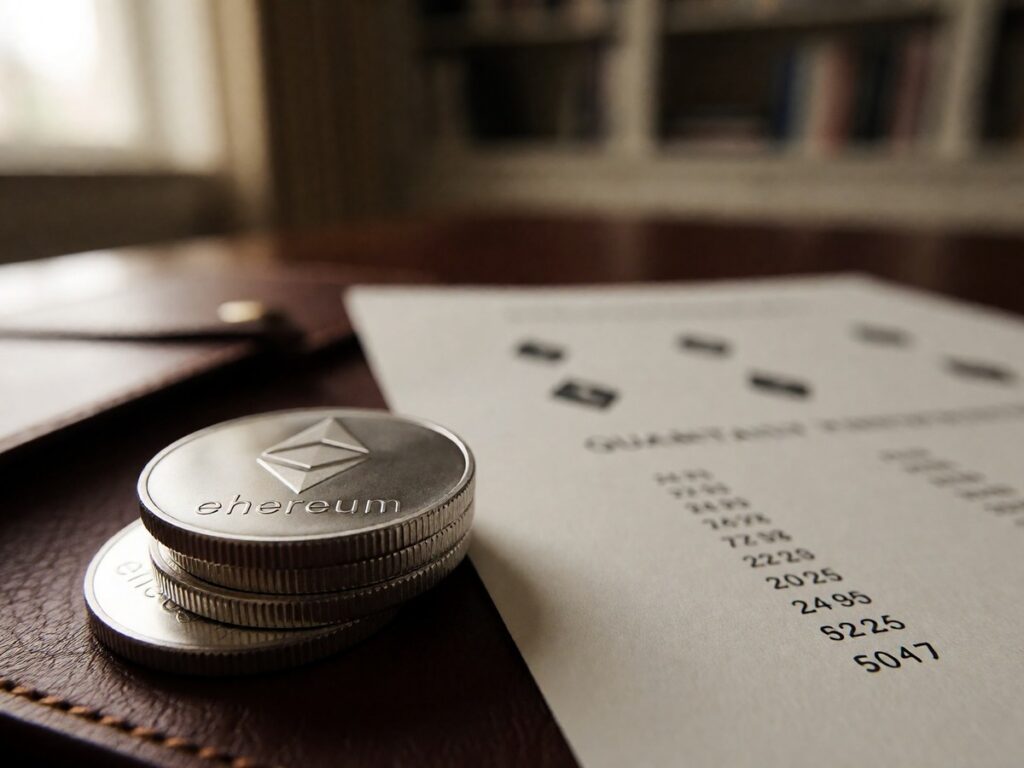
    BlackRock’s iShares Staked Ethereum Trust (ETHB) launched on Nasdaq on March 12, 2026, and reached $254 million in assets within its first week of trading. The fund stakes between 70% and 95% of its holdings through providers like Coinbase Prime, Figment, Galaxy Digital, and Attestant. After BlackRock takes an 18% service fee from gross staking rewards and charges a 0.25% annual sponsor fee, investors receive approximately 1.9% to 2.4% net annually. This fee is a 0.12% promotional rate for the first year on the first $2.5 billion in assets. The shift to staking ETFs transforms Ethereum from a passive asset into a productive yield-bearing instrument.

    Ethereum has faced a difficult 2026. ETH trades near $1,767 as of July 6, 2026, which is far below the bullish expectations of 2024. Citi cut its 12-month Ether target from $3,175 to $2,240 because of negative ETF flows and weak investor demand. The ETH/BTC ratio sits near 0.030 as of March 2026, which is a multi-year low.

    Understanding Ethereum ETF staking yields and fee structures (2)

    The fee war defines the market.

    The competition between issuers

    The Ethereum ETF market spent 2024 and 2025 competing on fees. BlackRock’s iShares Ethereum Trust (ETHA) charges 0.25%, and Fidelity’s Ethereum Fund matches that rate. VanEck undercuts them at 0.20%, and Franklin Templeton offers 0.19%. Staking changes the competition from management fees to yield spreads.

    Grayscale’s ETHE charges a 1.50% annual fee, which is six times what BlackRock charges. Grayscale distributed $9.4 million in staking rewards to investors on January 6, 2026. That payout was $0.083178 per share for rewards earned between October 6, 2025, and December 31, 2025.

    Fidelity filed an amendment to its FETH fund on August 11, 2026. The fund holds roughly $900 million in net assets. Fidelity will retain 85% of staking rewards and give 15% to service providers. The fund also has a 0.25% annual management fee.

    Fidelity’s FETH staking reward split provides 85% to shareholders.

    Regulatory developments

    The SEC and CFTC issued a joint interpretive release on March 17, 2026. This release classified staking rewards from 16 digital commodities, including ETH, as non-securities. The decision removed the legal barrier that prevented issuers from activating staking features. Before this, the SEC instructed issuers to remove staking from their filings. Now, the regulatory environment is more receptive to these products.

    The IRS issued Revenue Procedure 2025-31 on November 10, 2025. This procedure provides a safe harbor for exchange-traded products to stake proof-of-stake assets and distribute rewards. The safe harbor includes a 14-condition checklist covering custody, liquidity, and slashing. The transition window for existing trusts to adopt these rules expired on August 10, 2026.

    Tax rules change everything.

    Validator infrastructure and risks

    Staking ETFs use third-party validators to secure the network. BlackRock’s ETHB uses Coinbase Prime, Figment, Galaxy Digital, and Attestant. Fidelity’s FETH uses Blockdaemon, Figment, and Galaxy Digital Trading Cayman. Galaxy Digital and Figment serve as validators for multiple large U.S. Ethereum ETFs.

    This concentration creates risk. If a validator provider experiences a software bug or an outage, multiple funds feel the impact. Slashing is a real risk where the protocol destroys a portion of staked ETH for validator errors. Fidelity’s prospectus acknowledges that a slashing event results in an immediate reduction of the staked ether.

    Unbonding periods also create liquidity issues. Ethereum requires a waiting period to unstake assets that ranges from 9 to 50 days. Because of this, BlackRock stakes only 70% to 95% of its holdings. The remaining portion acts as a liquidity buffer for redemptions.

    Tax implications for holders

    The IRS treats staking rewards as ordinary income. Under Revenue Ruling 2023-14, rewards are taxable at fair market value when a user gains dominion and control. This applies to direct validators and exchange users alike.

    You should evaluate the fee math.

    When an investor sells a reward, they face capital gains taxes. The cost basis for the reward is the fair market value on the day of receipt. If you hold the reward for more than one year, you pay long-term capital gains rates. These rates are 0%, 15%, or 20% depending on your income.

    If you receive 2 ETH as staking rewards when ETH is at $2,500, you report $5,000 as ordinary income and that amount becomes your cost basis for the reward tokens.

    Parameter BlackRock ETHB Fidelity FETH Grayscale ETHE Direct Staking
    Net Annual Yield 1.9% to 2.4% ~2.2% Variable 3.1% to 3.3%
    Sponsor Fee 0.25% 0.25% 1.50% 0%
    Reward Share 82% to holders 85% to holders Variable 100% to holders
    Payout Frequency Monthly Quarterly Variable Varies

    Yield comparison and math

    Direct staking offers the highest yield. Ethereum’s network currently provides a gross annualized yield between 3.1% and 3.3%. Some validators earn more through execution-layer rewards like transaction fees and MEV.

    ETF yields are lower because of fees. BlackRock retains 18% of gross staking rewards. Fidelity retains 15% of gross rewards.

    If an investor holds a fund earning 2.2% net staking yield, the payout on a $10,000 position equals roughly $220 per year before the volatility of the price moves the USD-equivalent amount higher or lower each quarter.

    Comparing these options requires looking at the total return.

    Feature ETF Staking Liquid Staking (stETH) Direct Staking
    Accessibility High (Brokerage) Medium (DeFi) Low (Technical)
    Yield Efficiency Low (Fees apply) Medium High
    Tax Complexity Low (1099-DA) High (Daily/Rebase) High (Manual)
    Slashing Risk Managed by Fund Protocol Risk Full Risk

    Staking vs direct ownership

    Staking ETFs are different from direct ETH ownership. Direct holders earn the full network yield. They also maintain full control over their private keys.

    Staking ETFs provide convenience. They work in IRAs and 401(k) accounts. They use institutional-grade custodians like Anchorage Digital and BitGo. The fund manages the technical tasks of validator selection and slashing protection.

    The yield gap is the main cost. Grayscale’s ETHE fee is 1.50% annually. BlackRock’s ETHB fee is 0.25% annually. For many, the 18% reward fee paid to BlackRock is the price of regulatory safety.

    Will the SEC approve the next wave of filings?

    Market dynamics and decision making

    The Ethereum market is split. ETH is the dominant Layer 1 for DeFi with over 85% of the total value locked. It is the primary network for the $19.8 billion RWA tokenization sector.

    However, price action can undermine yield. In early 2026, ETH fell 46% from its August 2025 high. During this period, staking income for some products was erased by the price drop. A 3% staking reward does not protect an investor if the asset price falls 30%.

    Investors face fees, technical risks, tax complexities, and regulatory hurdles.

    The decision depends on the investor profile. Institutional managers often prefer the BlackRock or Fidelity models because they can defend a regulated product in a portfolio. They accept lower net yields for the ability to hold ETH in a brokerage account.

    Crypto-native investors often prefer direct staking or liquid staking protocols. They want the 3.1% to 3.3% gross yield without paying a service fee to a fund manager. They can manage the 9 to 50 day unbonding period themselves.

    Investors must decide if the convenience of a regulated wrapper outweighs the higher yields found in direct staking.

  • How Flutter’s leadership is driving FanDuel’s 2026 expansion

    How Flutter’s leadership is driving FanDuel’s 2026 expansion

    Peter Jackson leaves his role as Flutter CEO on September 30. He is also leaving his seat on the board of directors. This departure follows the removal of Amy Howe as FanDuel CEO earlier this summer. Dan Taylor, the current president of the international division, is the successor. The leadership transition happens as the company faces significant volatility in the US market.

    The company’s financial performance shows a stark contradiction. While Flutter reported a significant second-quarter earnings beat, investors focused heavily on the sharp drop in adjusted EBITDA and the lowered full-year guidance for the US market as the company increases its spending on prediction markets to capture new demand. Adjusted earnings were $0.49 per share, which is 25.6% above the $0.39 forecast. Revenue was $4.33 billion, which is 1.6% above the $4.26 billion forecast. However, US revenue fell 6% compared to the previous year. Adjusted EBITDA fell 45% year-over-year. The net loss for the quarter was $296 million.

    How Flutter's leadership is driving FanDuel's 2026 expansion (2)

    The stock is volatile. It dropped 10% recently. It hit a five-year low.

    FanDuel is fighting to catch up in the prediction market space. The rollout of FanDuel Predicts is slower than the company intended. This delay happened while rivals like Kalshi and Polymarket gained ground. In June, Kalshi held about 83% of the notional volume share among prediction markets. Flutter expects $50 million in revenue from prediction markets this year, but the company anticipates category expenses of more than $200 million.

    The strategy for FanDuel Predicts is shifting toward a partnership with Crypto.com. All sports and novelty contracts will migrate to the Crypto.com exchange. CME Group will still own a 51% stake in FanDuel Predicts. Customers will still have access to CME financial derivatives. This move aims to launch new products more quickly before the NFL season starts.

    You know the basics of how these platforms work.

    The leadership is changing.

    I find the DraftKings app is a bit too busy on smaller screens. It has more tools, but the interface is crowded. FanDuel is the better overall sportsbook for people who want speed. The FanDuel app is more stable. I like the streamlined interface.

    Category FanDuel DraftKings
    Welcome Bonus Up to $3000 in bonus bet tokens $200 in bonuses
    State Availability 23 states 26 states
    Customer Support Direct phone support Live chat, email, and callback
    Loyalty Program DFS only Dynasty Rewards
    App Experience Faster and streamlined Feature-rich and dense
    Payout Speed Faster Slower

    The competition in the US remains intense. FanDuel holds 38% of the market share. DraftKings holds 29% of the market share. Both companies are spending heavily to defend their positions. Flutter is spending $270 million in the second half of this year to support its US business.

    The betting markets are the main battlefield. DraftKings has a wider range of sports and more niche options. It is slightly better for NFL betting because it has more player prop bets and game props per game. FanDuel is better for odds on NFL futures. FanDuel also provides a better live betting experience. The interface is easier to use during live events.

    FanDuel’s mobile app is fast. Navigation is easy. The menus are clear. The live betting features are simple. The bet slip editing is smooth.

    I prefer the FanDuel live streaming. The FanDuel TV+ platform is better for watching games. DraftKings has NFL BetVision for live streaming.

    The economics of the industry are aggressive. Companies spend money on customer acquisition to harvest lifetime value. Analysts estimate the lifetime value is over $2,500 per customer. The cost to acquire those customers is between $300 and $400. This creates a high return for the firms that can scale.

    The industry is also moving into microbetting. FanDuel partnered with Simplebet to launch a free-to-play game for the NFL. This technology uses machine learning to create fast betting opportunities. It allows users to wager on specific plays, like whether the next play is a run or a pass. Simplebet wants a long-term deal to install this tech for real money bets.

    FanDuel is also expanding its golf presence. The platform integrated IMG Arena’s Golf Event Centre on August 10. This integration started with the FedEx St. Jude Championship. Fans can now bet on closest-to-the-pin or the number of birdies. It includes a data visualization experience to track shots in real time. The company also provided a 25% profit boost for live markets during the tournament.

    The rewards structures differ significantly. DraftKings uses the Dynasty Rewards program. This program uses points called Crowns to unlock perks. Users earn Crowns for placing bets on the sportsbook, DFS, and casino. FanDuel does not have a unified loyalty program for its sportsbook. Its loyalty program only covers daily fantasy sports.

    The welcome offers are also different. FanDuel’s offer is a bet-and-win mechanic. A user places a $5 wager and receives up to $300 in bonus bet tokens if the bet wins. These tokens expire after 24 hours. DraftKings offers a $200 bonus if a user spends $5. This is issued as bonus bets that expire after seven days.

    DraftKings is available in 26 states. FanDuel is available in 23 states.

    The regulatory landscape is changing. Prediction markets are regulated by the CFTC. They are treated as trading platforms rather than gambling platforms. This allows them to operate in states like California and Texas where sports betting is illegal. Jackson says prediction markets are incremental. He believes they capture new demand rather than stealing from traditional sportsbooks.

    How will Dan Taylor manage the pressure from the prediction market surge?

    I find the DraftKings rewards program is more structured. The tiered system gives users something to work toward. FanDuel is better if you want to place a bet and get your money quickly. The payouts at FanDuel are faster. DraftKings can be slower with certain withdrawal methods.

    DraftKings has a lot of features. The app is very good for beginners. It has guided betting features and tooltips. FanDuel is better for experienced bettors who want a fast interface. The mobile site for FanDuel is also very clean.

    The market for prediction markets is growing fast. Kalshi’s annualised trading volume is $39.7 billion. Michael Burry bought Flutter shares because he sees a fat pitch in the market. He blamed the recent drop in sports betting stocks on the rise of prediction markets.

    The US business for Flutter is under pressure. Revenue fell because of customer-friendly sports results. The NBA Finals and the World Cup caused higher payouts to players. This hurts the sportsbook margins. Management is spending more on generosity to protect its lead. They are investing in the long term.

    The convergence of sports and trading is the new reality. FanDuel is building a unified app to combine these two worlds. This app will be ready before the NFL season begins. It will integrate the sportsbook and the prediction market. This is a major part of the strategy to win in America.

  • The updated scale of the Nigerian economy

    The updated scale of the Nigerian economy

    The National Bureau of Statistics updated the Nigerian GDP base year from 2010 to 2019 during the 2025 rebasing exercise. This change captures economic structures before the pandemic. The nominal GDP for 2024 reached N372.8 trillion. This figure equals approximately $243.7 billion. This movement represents a 34.35% increase from the previous N277.5 trillion estimate. While the naira figure expands, the dollar value shrank because of currency depreciation. In 2013, the GDP reached $510 billion.

    The data shifted.

    The updated scale of the Nigerian economy (2)

    The National Bureau of Statistics updated the base year from 2010 to 2019 to capture the structural changes and technological shifts that occurred in the Nigerian economy before the pandemic disrupted market stability. This 2019 base year provides a period of relative normalcy for measurement. The 2024 nominal GDP of N364.6 trillion from other estimates also reflects this expansion. Real GDP shows a different story. Real GDP grew by 3.13% in the first quarter of 2025, which is an increase from the 2.27% recorded a year earlier.

    Statistical shifts in the base year

    Rebasing changes the base-year prices used to value final goods and services. It also updates the weights for different types of goods. The 2025 exercise incorporates new data from the 2019 and 2023 National Living Standards Surveys. It also uses the 2022 National Agricultural Sample Census Survey and the 2021 National Business Sample Census. These sources provide more granularity than the 2010 data. The 2025 methodology includes new areas like modular refineries, pension fund administrators, and the National Health Insurance Scheme. It even includes illegal and hidden activities.

    The new methodology for the Consumer Price Index (CPI) reflects changing spending. The number of items in the CPI basket rose from 740 to 960. The classification divisions increased from 12 to 13. The share of food and non-alcoholic beverages in the CPI fell from 51.8% to 40.1%. The category for restaurants and accommodation services rose from 1.2% to 12.9%. This change helps account for economic shifts like the removal of petrol subsidies. The CPI uses 2024 as the price reference period. It uses 2023 for the weight reference period.

    The economy remains volatile.

    Structural composition and sectoral movement

    The services sector provides 53.1% of the total output. Agriculture accounts for 25.8% of the economy. Industry follows these two sectors. In the 2010 series, the manufacturing share was 1.9%, but the new series shows it at 6.6%. Real estate is now the third-largest subsector. This follows the decline of crude petroleum and natural gas, which fell to fifth place.

    In 2014, the rebasing changed the view of the economy significantly. That exercise moved the base year from 1990 to 2010. It increased the GDP from $270 billion to $510 billion. That increase was 89%. The 2014 rebasing showed the telecommunications sector contributed more than a quarter of the increase. It also included Nollywood and mobile phone services. Traders also became a major contributor after the survey sample increased by ten times. In 2014, the oil and gas share was 32%, but it fell to 14%. Agriculture was 35% in 2014, but it fell to 22%.

    The services sector is large.

    In the 2024 revision, services remain the main driver. The services sector accounts for 53.1% of output. Agriculture accounts for 25.8%. Industry remains smaller. The manufacturing sector contracted in relative importance. Agriculture remains a large, labour-intensive sector.

    Economic Metric 2014 Rebasing Figures 2025 Rebasing Figures
    Base Year 2010 2019
    Total GDP (Naira) 80.2 trillion 372.8 trillion
    Total GDP (USD) $510 billion $243.7 billion
    Services Share 51% 53.1%
    Agriculture Share 22% 25.8%
    Informal Employment – 93% (Q2 2024)

    The invisible engine of informal labor

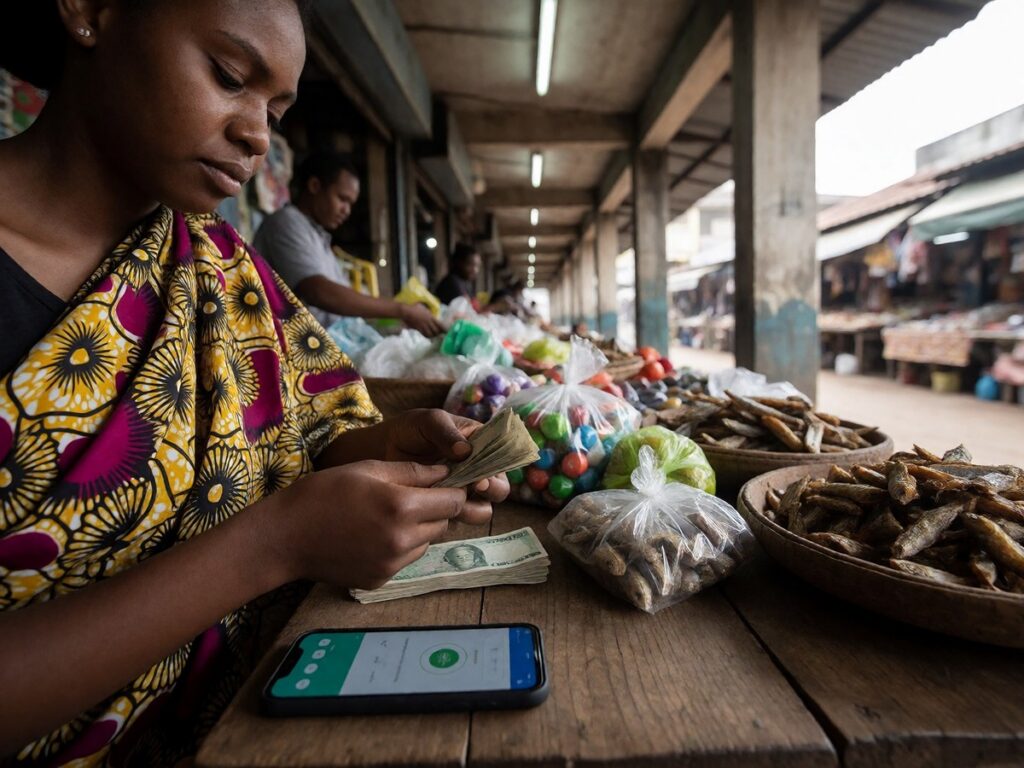
    The informal economy accounts for 42.5% of Nigeria’s rebased GDP. One sociological study by Talabi Ezekiel Adetola at Orebro University pegs the informal sector at 65% of GDP. Other estimates place the contribution between 55% and 65%. The National Bureau of Statistics reported that 92.3% of employment was informal in 2023. This rose to 93% in the second quarter of 2024. Urban informal employment accounted for 89% of urban jobs.

    You know the scale of the Nigerian market.

    The informal sector includes street trading, artisanal production, small-scale transport, and domestic services. These activities contribute to the GDP but stay outside formal regulatory frameworks. A one percent increase in the informal sector size associates with a 0.38% rise in long-run formal GDP per capita. Many businesses reach far beyond street markets. Fintech unicorns and startups operate within these flows. Moniepoint processed $17 billion in monthly transactions in 2024. PalmPay served 1 million SMEs in 2025.

    The figures rose.

    Digital growth and fintech expansion

    The digital economy will contribute 21% of GDP by 2027. Current digital economy revenues sit between 16% and 18% of GDP. The ICT sector accounted for 19.8% of real GDP in the second quarter of 2024. Digital revenues grew from $5.09 billion in 2019 to $9.97 billion in 2021. Nigeria is a Co-Champion of the AfCFTA Digital Trade Protocol. The legislature considers the National Digital Economy and E-Governance (NDEG) Bill. This bill would align national law with the AfCFTA Digital Trade Protocol.

    The NDEG Bill would enable electronic bills of lading. This could change how customs and logistics firms handle cross-border transactions. The digital economy includes mobile money transactions and music royalties. Fintech firms like Moniepoint raised $110 million in 2024. PalmPay reported 35 million registered users in 2025. These firms are part of the faster-growing sectors. The digital economy drives much of the current structural change.

    Trade liberalization and AfCFTA integration

    Nigeria adopted its tariff liberalization schedule in April 2025. This schedule covers 80% of traded goods. Nigeria ratified the Digital Trade Protocol in November 2025. As a member of ECOWAS, Nigeria follows a ten-year timeframe for tariff elimination. This allows Nigerian companies to access preferential tariffs across participating economies.

    The African Continental Free Trade Area (AfCFTA) includes 54 of the 55 African Union member states. It aims to close the gap in intra-African trade. Currently, intra-African trade is 14% of the continent’s total. Nigeria’s GDP in 2025 was roughly $290 billion. Full implementation of AfCFTA could boost Africa’s exports to the rest of the world by 32% by 2035. It could lift 50 million people out of extreme poverty.

    Trade barriers remain. Twenty-six member states have not implemented tariff liberalization. Four states, Libya, Sudan, South Sudan, and Eritrea, have not ratified the agreement. Infrastructure gaps and fragmented border systems keep trade costs high.

    Will the NDEG Bill pass the legislature?

    Fiscal ratios and debt management

    Rebasing changes the debt-to-GDP ratio. It fell from 52.13% to 39.4% following the 2025 update. This does not change the actual debt amount. The debt-to-GDP ratio was 52.13% before the new calculation. A larger GDP denominator improves this ratio. The World Bank guideline for debt-to-GDP is 55%. The government’s threshold is 40%.

    The tax-to-GDP ratio reached 13.5% in 2024. A larger GDP does not change the actual tax revenue. The ability to service loans depends on revenue flows. Nigeria faces high debt servicing costs. The country faces weak revenue mobilisation efforts.

    The growth is slow.

    Regional context of rebasing

    Other African countries also rebase their GDP. Kenya, Tanzania, Uganda, and Zambia all rebased in 2014. In Kenya, the 2013 rebasing increased per capita income from $994 to $1,269. This moved Kenya from low-income to lower-middle-income status. Tanzania’s GDP grew by a third after its rebasing. Uganda’s GDP rose by 13%. Zambia’s GDP increased by a quarter.

    In Tanzania, the 2007 benchmark rebasing showed agriculture at 26.8% and industry at 20.2%. The services sector was 47.6%. In Uganda, the 2013 rebasing showed manufacturing rose from 8.0% to 10.0%. Agriculture was 24.8% and services was 47.1%. These changes show structural shifts across the continent. Most African economies show an increase in services and a decrease in industry or agriculture.

    The path to a trillion dollar economy

    Nigeria wants a $1 trillion economy by 2030. A $240 billion economy requires 33% annual growth to reach this target. This rate exceeds the growth China achieved during its expansion. The goal remains ambitious.

    The 2025 rebasing provides a clearer picture of the economy. It shows the importance of the services sector and the digital economy. It also shows the scale of the informal sector. The manufacturing sector remains small. The tax-to-GDP ratio remains low. The country needs structural reforms to reach its target. These reforms include diversifying exports and strengthening institutions. Nigeria must also address currency volatility and inflation. The path to $1 trillion requires more than new statistical data.

  • Bitcoin in El Salvador: myths vs facts about Bukele’s 2026 IMF deal

    Bitcoin in El Salvador: myths vs facts about Bukele’s 2026 IMF deal

    The IMF mandate and policy reversal

    The International Monetary Fund approved a $1.4 billion Extended Fund Facility for El Salvador in late 2024. This 40-month program requires the government to change its Bitcoin policy. The IMF requires that the government limit its exposure to crypto assets. It also demands that the public sector participation in Bitcoin-related activities remains ring-fenced. The Legislative Assembly amended the Bitcoin Law in early 2025 to satisfy these IMF conditions. This amendment changed Bitcoin from a mandatory legal tender to a voluntary payment method. Private businesses no longer have a legal obligation to accept Bitcoin. The state cannot accept tax payments in Bitcoin. This shift happened because the IMF identified fiscal and financial stability risks. The government must reduce its direct involvement in Bitcoin-related activities. The program also requires the liquidation of the $150 million Fidebitcoin trust. This fund was created to support the Bitcoin rollout. The government must redirect these funds to reduce the budget deficit. The government must also phase out the Chivo wallet. The IMF identifies the state-run Chivo wallet as a source of fiscal risk. Negotiations to sell the wallet to a private operator are advanced.

    The Volcano Bond issuance

    The $1 billion Volcano Bond issuance targets the Bitcoin City project. The government plans to issue these bonds on the Bitifinex Securities Platform. This issuance was originally planned for March 2022. Several delays occurred because of declining Bitcoin prices and regulatory issues. The bonds carry a 6.5% yield and have a 10-year tenure.

    Bitcoin in El Salvador: myths vs facts about Bukele's 2026 IMF deal (2)

    The issuance is delayed.

    The proceeds will fund infrastructure and Bitcoin investments. Half of the money will go to infrastructure like geothermal mining. The other half will buy Bitcoin with a five-year lock-up period. The National Bitcoin Office expects the bond to launch in the first quarter of 2024. This initiative is part of the Bitcoin City project.

    Bitcoin City and geothermal power

    Bitcoin City will be a special economic zone located in La Union. The project is located at the base of the Conchagua volcano. The city will have residential areas, commercial zones, and an airport. Residents and businesses in the city will not pay income, property, or capital gains taxes. The only mandatory tax in the city is the value added tax. The government aims to use geothermal energy from volcanoes to power Bitcoin mining.

    Feature Detail
    Project Name Bitcoin City
    Location La Union, near Conchagua volcano
    Funding $1 billion Volcano Bonds
    Energy Source Geothermal
    Bond Yield 6.5%
    Bond Maturity 10 years
    Tax Status No income, property, or capital gains tax

    The project uses thermal energy from a volcano. This energy will support the mining of Bitcoin. The government plans to expand geothermal capacity by 2035. This expansion includes six or seven new 50 MW plants.

    Chivo and Fidebitcoin liquidation

    The IMF requires the liquidation of the $150 million Fidebitcoin trust. This fund was created to support the Bitcoin rollout. The government must redirect these funds to reduce the budget deficit. The government must also phase out the Chivo wallet. The IMF identifies the state-run Chivo wallet as a source of fiscal risk. Negotiations to sell the wallet to a private operator are advanced. The Chivo wallet was launched in 2021 with a $30 signup bonus.

    The Chivo wallet faced many issues. Identity theft caused the theft of signup bonuses. Most users stopped using the platform after they collected their bonuses. The government is winding down its participation in the Chivo system. You should remember that the Chivo wallet was the centerpiece of the 2021 strategy.

    The remittance reality

    Remittances are the main source of income for 30% of Salvadoran recipients. In 2024, remittances were 24% of the GDP. The US provides 98% of these flows. In the first half of 2026, remittances reached $5.06 billion. Only $35.4 million of that amount moved through crypto channels. This amount is only 0.7% of the total volume. Most transfers still use traditional agents like Western Union.

    Bitcoin was intended to lower the cost of these transfers. The government expected to save $400 million in fees annually. However, the participation rate in the crypto remittance market did not exceed 1% on a sustained basis since 2024. The economic model remains dependent on the US labor market.

    The state’s Bitcoin reserves

    The government holds approximately 7,700 BTC. This amount is worth about $490 million. The IMF prohibits new public sector acquisitions. The government maintains its existing holdings. While the government says it is not buying more, trackers show holdings near 7,734 BTC. The IMF says these changes are just transfers between government wallets.

    The government holds BTC.

    The reserves are not being sold under the IMF deal. The accumulation phase ended when the IMF placed a ceiling of zero on new purchases. The government remains committed to its reserve strategy.

    Adoption and user demographics

    Bitcoin adoption is low. A July 2026 poll from Universidad Francisco Gavidia says 92% of people do not use it. Only 7.5% use it for transactions. Research from Tobias Boos shows users are mostly young, urban, and male. These users already had bank accounts. The policy did not reach the rural or informal sectors.

    The Bitcoin experiment failed. The government failed to attract foreign direct investment through this policy. The goal to lower remittance costs failed. The plan to use Bitcoin for financial inclusion failed.

    Will the government resume Bitcoin purchases once the IMF program ends?

  • Caesars leads in odds boosts while BetMGM leads in betting variety

    Caesars leads in odds boosts while BetMGM leads in betting variety

    Thirty-nine states plus Washington D.C. and Puerto Rico operate legal sports betting markets in 2026. Caesars excels with higher volume odds boosts while BetMGM provides superior variety and live streaming options.

    BetMGM revenue and strategic growth

    BetMGM reported net revenue of $696 million for the first quarter of 2026. This figure marks a 6% increase compared to the same period last year. iGaming net revenue grew 9% year-over-year, while online sports net revenue grew 4% year-over-year. The company reported adjusted EBITDA of $25 million, which represents an 11% increase from the previous year. BetMGM maintains a 13% GGR market share in active markets, including a 20% share in iGaming and a 7% share in online sports. Handle per active user increased 23% year-over-year. NGR per active user grew 25% year-over-year. The company focuses on premium mass sports players and multi-product states to drive sustainable growth.

    Caesars leads in odds boosts while BetMGM leads in betting variety (2)

    BetMGM holds more markets.

    Caesars live in-game betting experience

    Caesars provides an in-game betting experience that refreshes odds on an inning-by-inning basis. The mobile app includes 2D game renders to provide additional information for bettors. Users can use the in-play betting setup to add items to a bet slip easily. The app provides quick odds refreshes. You know that market volatility dictates your profit margins.

    Caesars dominates the odds boost market.

    The reality of MLB player prop sharpness

    The industry consensus on market sharpness often ignores the underlying data. In a study of 600 million MLB player prop line movements, the gap between the sharpest and softest books remains minimal on high-volume markets. For example, RBIs show a Brier score difference of only 0.002, strikeouts differ by 0.003, and hits show a 0.005 difference. The market consolidates as first pitch approaches. Closing-line accuracy measures only how close a book gets to the final price. This metric fails to identify which books move first. A sharp book moves its lines in seconds when lineups drop, whereas a soft book lags behind. This lag creates a crossed market where the stale price provides value to the bettor. ProphetX and Kalshi lead the market in sharpness. They produce the most accurate prices for total bases and strikeouts. In contrast, Fanatics often lags behind. Pinnacle also remains slow on player props. These books show higher historical returns on their soft sides.

    Which operator will capture the most growth from the shift toward personalized player narratives?

    Comparing MLB betting markets

    BetMGM and Caesars provide different advantages for baseball fans. BetMGM wins in the MLB category due to its live MLB streaming feature and its specific MLB betting promotions. The brand maintains a long-running partnership with MLB and features visibility on MLB Network and Apple TV broadcasts. In contrast, Caesars provides more odds boosts and unique NBA betting promos. While BetMGM maintains its market position through extensive MLB streaming and deep niche sports markets, Caesars attracts high-volume bettors by providing dozens of daily odds boosts and a more beginner-friendly mobile interface.

    Operator MLB Welcome Offer Promo Code Key Condition
    BetMGM Up to $1,500 back in bonus bets ROTOSPORTS First bet loses
    Caesars Bet $1, double winnings up to $25 LSRDYW 10 tokens, 14 days
    DraftKings Bet $5, get $200 in bonuses None $5 wager
    FanDuel Bet and get up to $350 None $5 wager
    bet365 Bet $10, get $365 in bonus bets ROTOWIRE Win or lose

    Player performance data and prop markets

    Bettors can find many ways to wager on individual player performances. One common method involves betting on total bases. This market relies on recorded hits, as walks or hits by pitch do not count. Other bettors focus on strikeouts or home runs. For instance, a bettor might wager on Aaron Judge to hit a home run at +200 odds. Pitcher props also attract interest. A bettor can wager on the number of outs a pitcher records. If a pitcher records 19 outs, a bet to take the over on 18.5 outs wins.

    Specific player statistics provide context for these bets. Rafael Devers ranks in the 96th percentile for overall offensive skill. Bo Bichette is projected as the 6th-best batter regarding batting average talent. Teoscar Hernandez ranks in the 91st percentile for BABIP skill. Christian Walker ranks in the 90th percentile for home run skill. Isaac Paredes has a .351 wOBA this year. Francisco Lindor ranks in the 95th percentile for overall offensive ability.

    The markets change.

    Mobile application and loyalty programs

    The mobile experience differs between the two platforms. The BetMGM app provides a sleek interface and good mobile optimization for betting. The BetMGM Android app receives lower ratings than its iOS version. Users find the categories and search functionality could improve. The Caesars app has a clean design and a highly intuitive interface. It makes adding items to the bet slip simple.

    Both companies provide loyalty programs. BetMGM uses the MGM Rewards program. This program provides real-life perks like resort discounts. Caesars uses the Caesars Rewards program. This program provides Tier Credits and Rewards Credits. Users redeem these credits for dining, hotel stays, and entertainment.

    State handle and revenue comparisons

    The US betting market shows significant variation by state. New York leads the country with a July handle of $1,879,946,381. Illinois follows with $1,141,572,489 in May. New Jersey recorded $816,851,302 in handle for July. Arizona reached $663,931,556 in June. Ohio saw $658,859,016 in June. Pennsylvania reached $570,255,552 in June. Virginia saw $589,186,483 in June. Nevada recorded $578,715,596 in June. North Carolina reached $570,832,788 in June. Massachusetts saw $615,062,636 in June.

    Tax rates also vary by jurisdiction. New York and New Hampshire charge 51%. Pennsylvania charges 36%. Illinois uses a graduated system from 20% to 40%. North Carolina charges 18%. Virginia charges 15%. Louisiana charges 21.5% for online betting and 10% for retail. Iowa and Nevada charge 6.75%.

    BetMGM delivers revenue. Use Caesars for daily odds boosts or BetMGM for superior live streaming.

  • How India’s Q2 2026 manufacturing surge impacts Asian exporters

    How India’s Q2 2026 manufacturing surge impacts Asian exporters

    India’s manufacturing acceleration

    India’s GDP grew 8.2% in the second quarter of fiscal year 2026. This expansion marks a six-quarter high. Manufacturing grew 9.1% year on year. This figure outpaces the 2.2% growth from the same period last year. The secondary sector, which encompasses manufacturing and electricity, grew 8.1% annually. This surpasses the 4.0% growth recorded in the same period last fiscal year. Industrial output strengthened as the Index of Industrial Production rose 4.1% on average during the September quarter. This follows a 2.7% rise the year before. Private consumer spending, which makes up 57% of GDP, rose 7.9% year on year. Agriculture grew 3.5% in the second quarter. The mining sector contracted 0.04%.

    New Delhi’s trade realignment

    New Delhi shifted focus to China after U.S. tariffs hit 50%.

    How India's Q2 2026 manufacturing surge impacts Asian exporters (2)

    India’s exports to China rose 67% in December to $2 billion. Shipments to the U.S. dropped 1.8% to $6.8 billion. This drop followed steep tariffs from President Donald Trump. India’s trade with China reached $110.20 billion between April and December 2025. This value exceeded the $105.31 billion trade with the U.S. in the same period. India holds an $81.7 billion trade deficit with Beijing. It maintains a $26 billion trade surplus with Washington. India’s exports to mainland China rose nearly 37% during the first nine months of the fiscal year ending March 2026. Shipments to Hong Kong jumped more than 25% in that period. Relations between the two nations have thawed since Prime Minister Narendra Modi and Chinese President Xi Jinping met at the Shanghai Cooperation Organization summit in September. China acts as India’s largest goods trading partner. Foreign Secretary Vikram Misri met Vice Minister Sun Haiyan in New Delhi to discuss stabilizing bilateral ties. India’s trade secretary Rajesh Agrawal said the country is near a deal with Washington.

    Vietnam’s industrial momentum

    Vietnam’s GDP grew 8.4% in the second quarter of 2026. This follows 7.9% growth in the previous quarter. The industrial sector grew 10.5% year on year. This exceeds the 9.0% growth recorded in the first quarter. The agricultural sector grew 4.1% compared to 3.7% in the first quarter. FDI reached $13 billion in the first half of 2026. Samsung, Amkor, and LG Display drove these capacity build-outs. Vietnam is on track to record the fastest growth rate in ASEAN. The government targets 11.9% growth in the second half of the year. This aims to reach a 10% growth target for 2026. Vietnam’s GDP grew.

    The shift in Asian investment flows

    Total newly registered FDI into Vietnam reached $24.8 billion in the first five months of 2026. This represents a 34.9% increase year on year. Singapore led with $8.5 billion. South Korea followed with $6.7 billion. Mainland China ranked third in total registered capital. Indonesia recorded $1.74 billion in registered capital. These five economies account for 85% of total registered FDI. Large projects like the $4.9 billion Can Gio International Transshipment Port and the $2.2 billion GS Nha Be Metrocity project shaped the investment environment. The $2.1 billion AI data center in Tan Phu Industrial Park also contributed to these totals. Thai Nguyen province led FDI attraction with $7.6 billion.

    Export product composition

    Electronics exports dominate the Vietnamese economy.

    Electrical machinery and equipment (HS 85) accounts for 40% to 50% of Vietnam’s top exports. In the first quarter of 2026, shipments of electronic products and semiconductors increased by over 40% year on year. Phone exports rose 23.1% in that period. The U.S. buys 32% of Vietnam’s exports. China buys 15%. Machinery (HS 84) grew 18.2% in the first quarter of 2026. Vietnam is the world’s second-largest coffee producer. It is the largest producer of Robusta beans. Footwear remains a major category. Vietnam produces shoes for Nike, Adidas, and Puma. Furniture (HS 94) exports benefit from the EVFTA. The U.S. is the largest market for Vietnamese furniture. The industry uses the substantial timber and wood-processing sector in Vietnam.

    Metric India Vietnam
    Manufacturing Labor Cost $2-3 per hour $294-347 per month
    FDI (Jan-May 2026) Not specified $24.8 billion
    Top Export Market Not specified USA (32%)
    Industrial Land Cost $30-60 per m2 $177-200 per m2
    Trade Agreement Access Not specified 16 active FTAs

    Comparative costs and incentives

    India’s PLI scheme allocates INR 9,000 crore to electronics and IT hardware for 2025-26. This is an increase from INR 5,777 crore in 2024-25. The program covers 14 sectors. Vietnam’s new Corporate Income Tax Law, effective October 2025, offers a 10% preferential rate for 15 years in AI and semiconductors. This applies to projects in high-tech parks. In India, labor costs in the organized sector average $2 to $3 per hour. Vietnam’s factory workers earn VND 7.7 to 8.4 million per month. Social insurance in Vietnam adds 22% to base costs. India’s social security adds 17% to 20% to base costs. India’s labor costs remain 15% to 25% lower than Vietnam at comparable skill levels.

    Infrastructure and land realities

    Vietnam has many industrial zones. Northern zones have occupancy rates above 80%. Southern zones have occupancy rates between 89% and 92%. Land costs in northern Vietnam reach $177 to $200 per square meter. India’s Tier 2 cities like Pune or Coimbatore offer land at $30 to $60 per square meter. India’s National Infrastructure Pipeline involves INR 111 lakh crore. Dedicated freight corridors and Sagarmala port modernization support growth. You should prioritize India if you want to reach 1.4 billion consumers. Will the U.S. Section 301 investigation result in higher tariffs for Vietnam?

    Direct market recommendations

    Vietnam’s export story changed as it moved into electronics. The country is one of the largest furniture exporters. It is also a top three apparel exporter. The US market accounts for 32% of Vietnam’s exports. China remains a vital partner, acting as both a supplier and a second-largest buyer. Because the U.S. applied a new 12.5% levy on Chinese products in late July, manufacturers rushed to ship goods ahead of potential new tariffs, which drove Chinese exports up 23.9% to a total of $397.85 billion. India’s manufacturing grew. China’s exports rose. Vietnam’s GDP grew. India remains the best option for domestic market access. Vietnam provides a better platform for pure export operations.

  • The SEC’s 2026 crypto enforcement pause explained

    The SEC’s 2026 crypto enforcement pause explained

    Gary Gensler resigned from his position as SEC Chair on January 20, 2025. Paul Atkins took the chair on April 21, 2025, after Mark Uyeda served as Acting Chair from January 21 to April 21. Atkins, a former Commissioner from 2002 to 2008 and former CEO of Patomak Global Partners, replaced the previous administration’s aggressive stance toward digital assets. This leadership change immediately altered the direction of the agency.

    The pivot happened.

    The SEC's 2026 crypto enforcement pause explained (2)

    The decline in enforcement actions

    The statistics from 2025 demonstrate a significant shift in how the SEC handles digital assets. In 2025, the SEC initiated only 13 cryptocurrency-related actions, which marks a 60% decrease from the 33 actions brought in 2024. Monetary penalties against digital asset market participants totaled $142 million in 2025, a figure representing less than 3% of the penalties from 2024. Most of the 2025 enforcement activity occurred before Gensler left the agency. Specifically, 5 of the 13 actions involved cases brought under Gensler’s leadership. In contrast, the 8 actions initiated under Atkins all involved allegations of fraud. The agency’s total enforcement actions for FY 2025 reached 456, the lowest total in roughly 20 years.

    I find the sudden drop in crypto-specific activity quite telling. The transition from Gensler to Atkins removed the primary driver of "regulation by enforcement" that defined the previous years. While the previous administration used investigative sweeps to target various market participants, the current leadership prefers focusing on cases involving "liars, cheats, and thieves." This change in philosophy directly correlates with the lower numbers in the crypto space.

    Policy-driven case closures

    The SEC began dismissing legacy litigation almost immediately after the administration changed. The agency dismissed its enforcement action against Coinbase with prejudice, a move aimed at reforming the regulatory approach to the crypto industry. Shortly after this dismissal, the Commission closed several investigations into Gemini, Uniswap Labs, and the NFT platform OpenSea. These closures occurred even though the agency had previously issued Wells notices to those entities. The agency also closed actions against other players like Crypto.com, Binance, Robinhood, and Ondo Finance throughout 2025.

    The numbers don’t lie.

    The dismissal of the Coinbase case signaled that the SEC would no longer pursue the same legal theories used by the previous leadership. Instead of focusing on whether tokens constitute unregistered securities, the current Commission prioritizes traditional fraud and market manipulation. I see this as a calculated retreat from the aggressive policing of the "Wild West" environment that Gensler frequently mentioned.

    A new regulatory framework

    On August 18, 2026, the SEC introduced Regulation Crypto Assets, a proposal that provides a tailored regime for certain investment contracts. This proposal serves as the centerpiece of Chairman Atkins’ "Project Crypto." It aims to provide crypto innovators with pathways to raise capital while maintaining investor protections. The framework relies on the Howey test but creates specific exemptions to accommodate the unique nature of blockchain technology.

    The proposal targets "covered investment contracts," which include assets that are not themselves securities but are subject to an investment contract. The framework includes four main components: an investment contract safe harbor, a startup exemption, a fundraising exemption, and the preemption of state registration requirements. Once a network becomes functional and the issuer completes its promised development, the asset can exit securities regulation through the safe harbor.

    Feature Startup Exemption Fundraising Tier 1 Fundraising Tier 2
    Maximum Raise $5 million $20 million $75 million
    Offering Period 4 years 12 months 12 months
    Financials No financial statements Principles-based narrative Audited (per PCAOB/GAAS)
    Issuer Type Any entity/group U.S. entity U.S. entity
    Resale No restrictions No restrictions No restrictions
    Regulatory Filing Form NOR Form 1-CRYPTO Form 1-CRYPTO

    The mechanics of crypto exemptions

    The startup exemption provides a one-time way for early-stage projects to raise funds. Issuers can raise up to $5 million over a four-year window by filing a notice of reliance on Form NOR. This exemption allows for a broad range of transactions, including airdrops, staking rewards, governance distributions, and gas fees. It does not require financial statements and allows for general solicitation.

    The fundraising exemption offers a larger pathway for more established projects. It operates in two tiers, modeled after Regulation A. Tier 1 allows for up to $20 million in a 12-month period, while Tier 2 allows for up to $75 million. Both tiers require issuers to be U.S. entities and file offering statements on Form 1-CRYPTO. Unlike the startup exemption, Tier 2 requires audited financial statements. Both exemptions allow tokens to be traded without resale restrictions, and they both preempt state "blue sky" laws.

    You should watch the November departure of Hester Peirce.

    The enforcement division reorganization

    The Enforcement Division underwent massive changes in 2025 and 2026. Judge Margaret Ryan resigned as Director on March 16, 2026, after serving only six months. David Woodcock took the role on May 4, 2026, after serving as Acting Director. Woodcock previously directed the Fort Worth Regional Office and worked as a partner in private practice. The agency also saw the appointment of Osman Nawaz as Deputy Director in July 2026.

    The division faced significant staffing challenges during this period. The workforce fell by 15% compared to the previous administration. Hundreds of employees accepted voluntary resignation offers as part of the administration’s efforts to reduce the federal workforce. In April 2025, the SEC implemented a targeted reorganization to restructure management and reporting. This staffing downturn, combined with a focus on quality over quantity, contributed to the lower enforcement numbers. The division also established the SOX Group to focus on auditing standards following budget cuts to the PCAOB.

    Updated cooperation and process rules

    The SEC released a new Enforcement Manual on February 24, 2026, which provides the first comprehensive update since 2017. The new manual emphasizes that the SEC will review and refresh its processes annually. It places a heavy emphasis on how companies can receive cooperation credit. The new rules require companies to report misconduct to the SEC before the staff finds out through other sources.

    The new enforcement manual, which the Division of Enforcement released on February 24, 2026, emphasizes that companies must proactively report misconduct to the SEC before the staff learns of it from other sources to receive any hope of cooperation credit. To get credit, companies must engage in effective self-policing, prompt self-reporting, and active cooperation. The SEC also created a new Cooperation Committee to approve all recommendations for deferred prosecution or immunity.

    The rules also changed the Wells process. Staff must now provide greater access to the investigative file so recipients can respond to charges. Written submissions must stay under 40 pages, and video submissions must not exceed 12 minutes. Post-Wells meetings must occur within four weeks of the submission and require a senior official to attend.

    A shrinking Commission

    The Commission currently operates with only three members: Chairman Atkins, Commissioner Peirce, and Commissioner Uyeda. Commissioner Caroline Crenshaw departed in January 2026. Commissioner Peirce will leave the agency in November 2026 to join Regent University School of Law. This leaves the Commission with a single-party majority.

    The Commission follows a quorum rule where three members usually constitute a quorum. However, if the number of commissioners falls below three, the members in office constitute a quorum. This means that if Peirce leaves, Atkins and Uyeda can still make decisions alone. They could approve settlements, rulemaking, or enforcement recommendations without any minority party input. This structure removes the bipartisan check that the original legislative design intended.

    Will the two-member quorum hold when the next vacancy arrives?

    The authority to remove commissioners

    The legal ability of the President to control the SEC changed because of the Supreme Court. In the case of Trump v. Slaughter, the Court overruled nearly 90 years of precedence. The decision held that for-cause removal protections for commissioners of independent agencies violate the separation of powers. This ruling restores the President’s authority to remove commissioners at will.

    This decision impacts the long-term stability of the Commission’s independence. While the SEC has traditionally taken pride in nonpartisan decisions, the removal of these protections means the President can exert more direct influence over the agency’s leadership. This power allows the administration to ensure the Commission follows the policy goals of the White House without the hurdle of independent commissioner protections. The legal battle over the removal of agency heads has now reached its conclusion, changing the power balance between the White House and the SEC.

  • DraftKings NFL acquisition spend versus FanDuel retention pivot

    DraftKings NFL acquisition spend versus FanDuel retention pivot

    DraftKings is the leader in aggressive customer acquisition for the 2026 NFL season. The company spent $36.4 million on linear TV ads from August 15 through the first three weeks of the season. This amount is a 22% increase compared to the same period last year. FanDuel spent $27.1 million during this period, which is a 14% increase from the previous year. I see these numbers as a clear distinction between two different economic paths.

    DraftKings is pushing hard on driving new users. The company reported that customer acquisition rose nearly 75% year over year during the second quarter. Sports consumer volume increased 15% during this same period. Executives said that stronger than expected customer acquisition prompted increased marketing investment. They said acquisition costs remained below expectations.

    DraftKings NFL acquisition spend versus FanDuel retention pivot (2)

    The current DraftKings promotion targets casual bettors with a low barrier to entry. A user spends $5 and receives $200 in bonus bets. This offer does not require a promo code. The bonus bets arrive as four $50 increments every 7 days over a 21 day period. This specific offer ends on September 20, 2026. I think this is a smart way to keep users engaged throughout the start of the season.

    DraftKings also has a 20% deposit match for those with larger bankrolls. This match is worth up to $1,000. A user needs to deposit at least $5 to qualify. However, a $5,000 deposit is required to earn the full $1,000 bonus. The company releases $1 in site credits for every $25 played. This means a user must play through $25,000 to earn the entire bonus. The market is maturing.

    FanDuel is focusing on player retention. Flutter CEO Peter Jackson admitted the company did not execute its "generosity strategy" effectively. The company expects core profit to grow 4% in 2026 to $2.97 billion. This is much lower than the $3.5 billion projected by analysts. The company faces a cooling period in US betting activity.

    FanDuel targets retention. The company spends roughly $290 per new customer. This investment expects a payback in 12 to 18 months. A 5% increase in player retention can result in a 25% profit increase. You likely saw advertising for these platforms since sports betting became legal in many states over four years ago. Only 52% of bettors make more than two deposits. Only 4% are loyal to a platform for longer than a year.

    While DraftKings continues to push hard on driving new users via heavy television advertising and generous sign-up bonuses, FanDuel is attempting to stabilize its bottom line by focusing on keeping its existing player base engaged through a new loyalty program.

    Feature DraftKings FanDuel
    TV Ad Spend $36.4 million $27.1 million
    Welcome Offer $200 in Bonus Bets $100 in Bet Resets
    Minimum Wager $5 $5
    Qualification Any qualifying bet First wager must win
    Expiration 7 days 7 days
    Deposit Match 20% up to $1,000 Not specified
    Market Share 37% 41%

    The two apps provide different experiences. DraftKings has a feature-rich interface. It has expanded prop markets and parlay builders. The interface feels busier on small screens. It provides advanced filters and bet builder options. FanDuel is streamlined. It emphasizes speed and ease of use. The navigation is straightforward. Menus are clearly labeled. Page loads are generally quick.

    Prediction markets are a new battlefield. DraftKings says more than 600,000 customers used its prediction offering this year. This business is growing faster than they anticipated. There is only 1% customer overlap between prediction markets and the largest prediction market operator. Most volume comes from professional traders. DraftKings intends to build a super app that combines sportsbook, fantasy sports, iGaming, and prediction markets.

    FanDuel is also investing in this space. The company launched a prediction market business in late December 2025 with CME Group. This investment might reduce 2026 core profit by $200 million to $300 million. FanDuel offers non-sports markets in all 50 states. It offers sports-related prediction markets in 18 states, including California, Texas, and Florida.

    DraftKings is the better choice for those seeking variety and aggressive promos. The $200 bonus for a $5 bet remains one of the most accessible offers available. FanDuel is the better choice for those who want a stable, fast app. I will watch if the new loyalty program stabilizes their revenue.