Real GDP for the March 2026 quarter grew 7.8% compared to the previous year. This growth exceeds the 7.2% expectation from market analysts. Manufacturing output grew 7.3%, while financial and real estate services grew 10.4%. Trade, hotels, transportation, and communication grew 12.5%. Construction grew 8.4%. Mining and quarrying grew 5.4%. Agriculture and feedstock grew 3.6%. For the full 2026 financial year, GDP expanded by 7.7%. This follows the 7.1% growth recorded in 2024. The 2020 contraction of 5.8% remains the largest setback in recent history. Historically, India’s share of world income fell from 22.6% in 1700 to 3.8% in 1952. The Mughal economy in the 17th century produced about 25% of global industrial output.
| Sector | GVA in 2024-25 (INR Crore) | Share (%) |
|---|---|---|
| Agriculture | 2,476,805 | 14.41% |
| Industry | 5,270,112 | 30.66% |
| Services | 9,440,530 | 54.93% |
| Manufacturing | 4,169,419 | 13.89% |
| Construction | 2,627,209 | 8.75% |
The UPI transaction scale
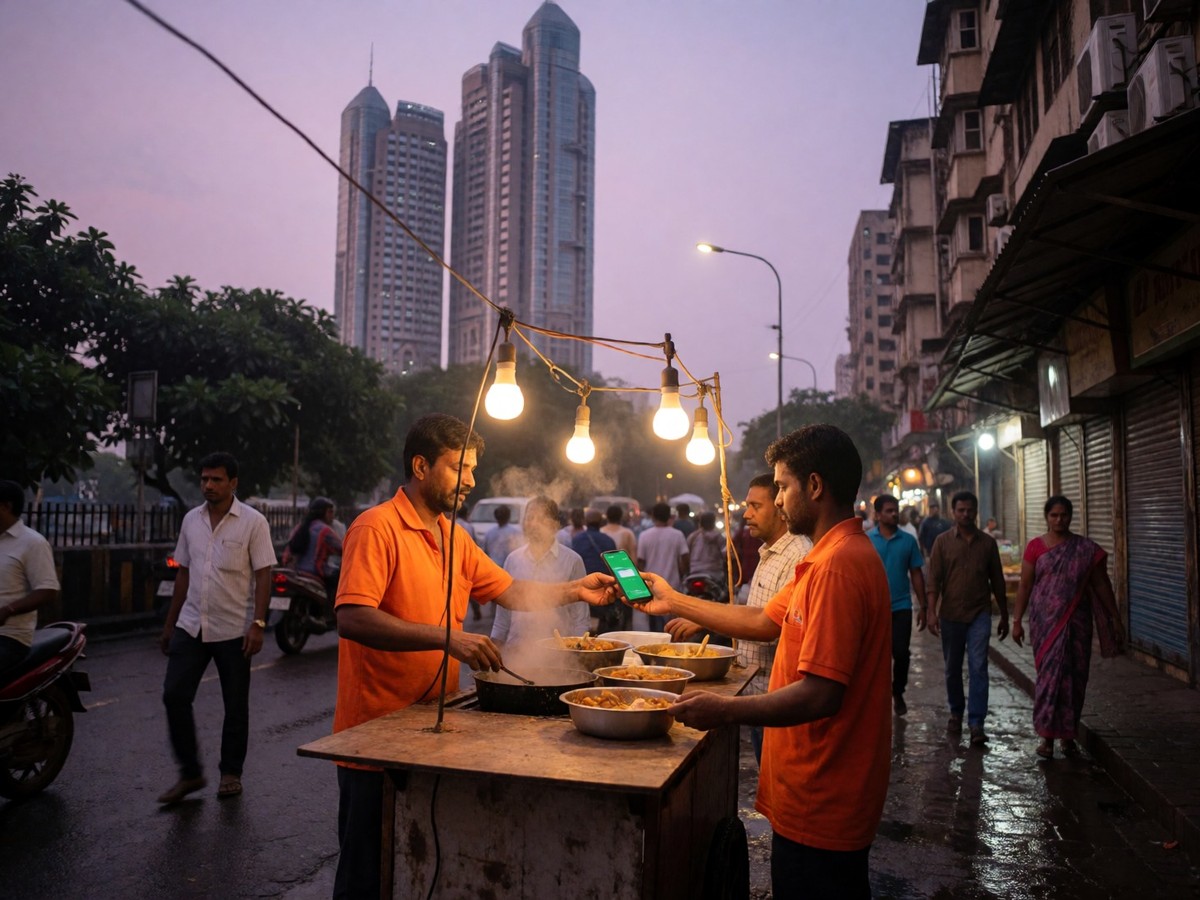
The Unified Payments Interface (UPI) provides a low-cost digital transaction layer that reaches businesses far outside the formal corporate economy, helping to facilitate greater financial inclusion for millions of small merchants across the country. In the 2025-26 financial year, UPI processed 24,161.69 crore transactions. This transaction value exceeded ₹314 lakh crore. The network expanded from 21 banks at launch to 703 banks by March 2026. In August 2025, UPI recorded 1,270.5 crore person-to-merchant transactions worth ₹7.24 lakh crore. The IMF reported in June 2025 that UPI is the largest retail fast payment system globally, accounting for 49% of global real-time digital transactional systems. In FY2017-18, UPI processed 91.5 crore transactions. By FY2024-25, the volume reached 18,587 crore transactions. This reflects a CAGR of 114%. The JAM Trinity provided the foundation for this expansion. Jan Dhan accounts exceeded 558.3 million by July 2025. Aadhaar issuance reached 142 crore cards by June 2025. Mobile connectivity reaches 116 crore subscribers.
Micro-enterprise and vendor credit integration
Micro-enterprises lead the MSME sector. MSMEs contribute 30.10% of India’s GDP at current prices. They generate 36% of all manufacturing output. These businesses employ over 24 crore people. Micro-enterprises account for 98.60% of registered units. MSME exports rose from Rs. 3.95 lakh crore in FY21 to Rs. 12.39 lakh crore in FY25. Export counts grew from 52,849 to 1,73,350 in the same period. The PM Street Vendor’s AtmaNirbhar Nidhi scheme supports urban street vendors through digital incentives. By July 2026, 76.95 lakh street vendors took 1.15 crore loans worth ₹18,475.06 crore. More than 55 lakh beneficiaries used digital onboarding. These vendors completed 841 crore digital transactions worth ₹8.96 lakh crore. A 2025 impact assessment by the Indian School of Business found that average annualised business income among SVANidhi borrowers increased by 20% between 2023 and 2025. The Automatic Milk Collection platform covers 17.3 lakh milk producers. The KANCHI platform profiles 45,000 small farmers in Odisha, Tamil Nadu, and Uttar Pradesh. You should note the shift in credit access.
Trade and monetary policy trends
The US-India trade deal, announced in February, reduced tariffs on Indian goods from 25% to 18%. This reduction provides a 0.2 percentage point boost to annual GDP. This brings India’s tariff rate in line with other Asian countries, which typically range from 15% to 19%. In June, the RBI kept policy rates unchanged to support credit growth. Credit growth reached 17.7% in June, the highest level since May 2024. Overseas investors invested US$4.2 billion in Indian government bonds in June. This inflow marks the strongest since August 2024. Tensions in the Middle East keep input costs high. The European Central Bank announced a rate hike at its June meeting. Growth remains steady. Tariffs dropped to 18%. Vendors use digital tools. Will the rural consumption surge persist?