Blog

  • Chelsea’s Clearlake restructuring versus Arsenal’s Emirates model

    Chelsea’s Clearlake restructuring versus Arsenal’s Emirates model

    Chelsea faces regulatory pressure

    UEFA issued Chelsea a €3m (£2.6m) fine for breaching its 2025 squad cost ratio limit. Two million euros of this penalty remains conditional on Chelsea reducing its squad cost ratio in 2026. This follows a 2024 breach where the club paid an €11m fine. In 2024, the squad cost ratio limit sat at 80 per cent. The limit fell to 70 per cent in 2025. Chelsea still exceeded this 70 per cent limit despite winning the Club World Cup last year. The £84.5m earned from that competition fell into the 2025 calculation for UEFA purposes because the governing body counts non-performance distributions when clubs receive them. Chelsea also recorded around £48m of its £80m in Champions League prize money during the 2025 calendar year. This mismatch between seasonal spending and accounting periods creates difficulty for the club.

    The club faces a long period of monitoring. Chelsea remains subject to a settlement agreement until the end of the 2028-29 season. A breach of this agreement could result in a one-year ban from European competition. In 2024, the club also faced a €20m fine for breaching football earnings rules. That breach included a threat of a total fine of €80m. The club is currently fifth in the Premier League with a wage bill of £97m. It finished 10th in the league last season, which means the club will not play in Europe in 2026-27. This absence of European football will remove a major source of income for the upcoming season.
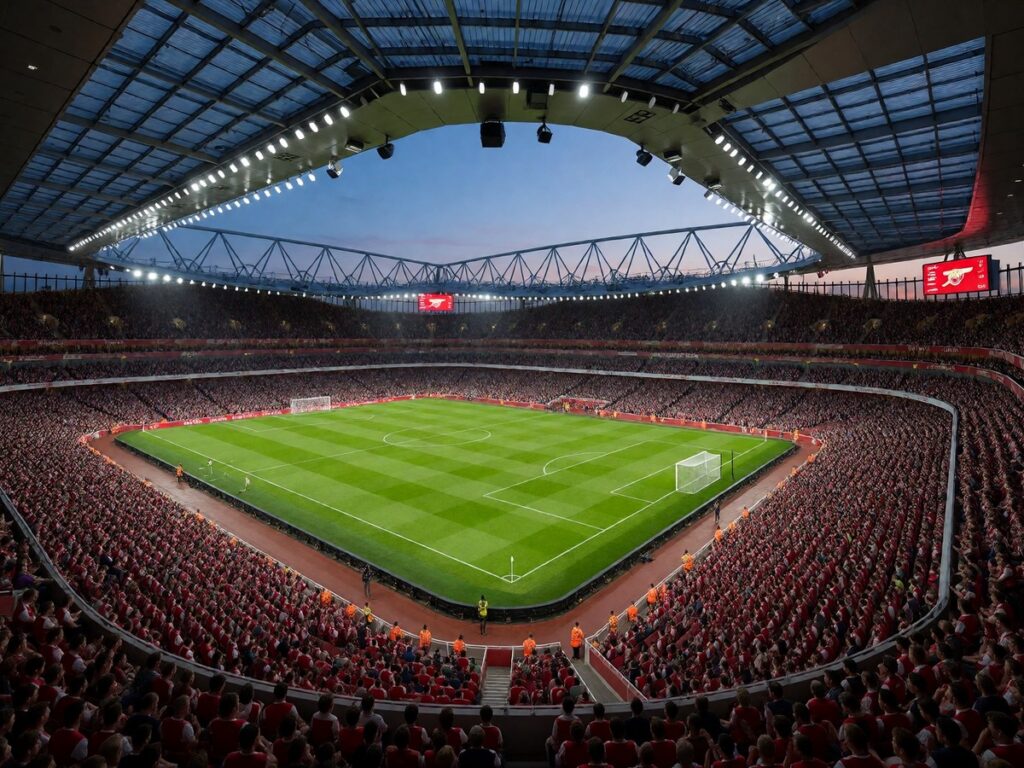
    Chelsea's Clearlake restructuring versus Arsenal's Emirates model (2)

    Clearlake restructuring and ownership shifts

    Clearlake Capital holds 61.5% of Chelsea. The firm is now negotiating to buy out co-owners Todd Boehly and Mark Walter. This deal values the club at approximately £5bn. Mark Walter seeks to raise funds to pay insurers following a US federal investigation into $21bn in loans. Chelsea reported a pre-tax loss of £262.4m for the year ending June 30 2025. This loss is the largest ever recorded by a Premier League club. It exceeds the £197.5m loss reported by Manchester City in 2010/11. The club paid agents £65m over the last 12 months. This is the highest amount paid to agents in the Premier League.

    The ownership transition intends to ease internal tensions. Clearlake already maintains day-to-day operational control. The buyout of Boehly and Walter should simplify decision making at Stamford Bridge. This restructuring also addresses disagreements regarding the redevelopment of the stadium. Behdad Eghbali has clashed with Boehly over whether the club should rebuild Stamford Bridge or move to a different site. Chelsea’s financial position remains precarious as the club manages its high cost base. The club also faces pressure from the Premier League’s profitability and sustainability rules.

    Player trading and contract length tactics

    Chelsea relies on player trading to manage its balance sheet. The club generated £314.4m from player sales in the summer of 2025. This included Noni Madueke for £52m, Kiernan Dewsbury-Hall for £29m, and Djorde Petrovic for £25m. The club also sold its women’s team to BlueCo Midco for almost £200m. The club’s decision to sign players on decade-long deals is a massive gamble that risks long-term squad imbalance. Chelsea uses long contracts to spread the cost of players over many years. Cole Palmer has a ten-year deal. Pedro Neto and Joao Felix both signed seven-year contracts. The Premier League capped the amortisation period at five years for new contracts in December 2023. This rule does not apply to players signed before that date.

    The club treats players as assets to be traded for profit. This strategy involves buying talent early and selling them when they gain value. For example, the club sold Angelo Gabriel to Al-Nassar for £19.4m. This sale resulted in a £9m accounting profit. The club has signed over 35 players across five transfer windows since 2022. The total outlay for these transfers reached nearly £1.2 billion. Only £440m was generated from player sales during that same period. This results in a net transfer spend exceeding £700m. The club’s squad includes approximately 42 players. Many players are currently out on loan to other clubs.

    Arsenal’s revenue growth and Emirates model

    Arsenal expects a record revenue of £793.3m for the 2025/26 season. This follows a £617m revenue in the 2023-24 season. The club won the Premier League title for the 2025-26 season. Arsenal also reached the Champions League final in 2025/26. The club’s broadcast revenue for the 2025/26 season is estimated at £325.4m. This includes £198.7m from Premier League distributions and £123.8m from UEFA distributions. Commercial revenue for the 2025/26 season is estimated at £305.7m. This follows a $280 million commercial revenue in 2024/25.

    The club operates on a self-sustaining business model. Managing director Vinai Venkatesham says all pitch investments come from revenues generated off the pitch. Arsenal’s commercial growth comes from Adidas contract increases and the Sobha Realty Training Centre naming rights deal. Matchday revenue from 25 games at the Emirates Stadium in 2024/25 reached $166 million. This was a 28% increase from the previous year. The club also increased ticket prices for men’s fixtures by an average of 3.7%. Arsenal’s revenue growth remains tied to its performance on the pitch.

    Financial Metric Chelsea (2025 Reported) Arsenal (2025/26 Estimated)
    Total Revenue £490.9m £793.3m
    Pre-tax Profit/Loss (£262.4m) Loss £31.0m Profit
    Annual Wage Bill £97m £396.8m
    Champions League Income £80.2m £123.8m

    Comparing wage bills and squad costs

    The gap between Chelsea and Arsenal in wage expenditure is large. Arsenal’s recurring wages for the 2025/26 season reach an estimated £396.8m. This includes a £40m increase for sporting-related wages and a £10m increase for non-sporting wages. Arsenal’s wage bill for the 2026-27 season is estimated at £154m. This places the club third in the Premier League for wage expenditure. Arsenal currently sits at the top of the Premier League table.

    Chelsea’s wage bill for the 2026-27 season is £97m. This puts the club seventh in the league for wage spending. The difference in spending levels shows two different approaches to squad management. Chelsea carries a high cost base through massive transfer outlays and long contracts. Arsenal grows its spending in line with its rising revenues. Other Premier League clubs show different patterns. Hull City has a wage bill of £52.9m but sits third in the league. Liverpool has the highest wage bill at £177m but sits seventh. Aston Villa has a £98m wage bill and sits 19th.

    The impact of European football

    European competition creates significant differences in club cash flow. Arsenal’s revenue grew because it returned to the Champions League. The club’s broadcast revenue increased because it reached the quarterfinals in 2023-24 and the final in 2025/26. Arsenal received a $101 million distribution from the competition in 23/24. This is much higher than the $28 million it received when it was in the Europa League.

    Chelsea faces a different reality. The club won the Club World Cup last year, which brought in £84.5m. However, the club will not play in Europe in 2026-27 because it finished 10th last season. This will reduce the club’s revenue for the next cycle. Without Champions League money, the club must find other ways to pay its expensive squad. The club is also subject to the squad cost ratio, which counts revenue against squad spending. High revenue from European prize money helps clubs meet this ratio. Chelsea’s high underlying costs remain a concern without that extra income.

    Ownership philosophies and stability

    The ownership structures of the two clubs dictate their financial flexibility. Chelsea is managed by a private equity consortium. Clearlake Capital and its partners aim to grow the club’s value to flip it for a profit. This approach leads to high spending and a focus on player trading. The owners treat players as assets to be developed and sold. This model creates volatility in the squad and the accounts.

    Arsenal is owned by Stan Kroenke. He bought out Alisher Usmanov for £550m to take full control of the club. Arsenal follows a model where the club grows through its own revenue. It does not rely on massive injections of cash from owners to cover operating losses. The club’s commercial and matchday growth funds its pursuit of trophies. You understand the logic: high spending requires high revenue to avoid UEFA sanctions. Arsenal builds its strength through internal growth, while Chelsea builds its strength through external investment and asset trading.

    Will Chelsea’s reliance on trading youth players eventually hit a ceiling that no amount of amortisation can fix?


  • US labor market cooling hits private sector and job openings

    US labor market cooling hits private sector and job openings

    ADP August Payroll Miss

    ADP reported 38,000 new private-sector jobs for August 2026. This figure missed the Dow Jones consensus estimate of 47,000. It also fell below the 48,000 estimate from other economists. This monthly total is the weakest hiring pace since January. The August figure is below the revised July total of 46,000. ADP previously reported July’s count at 44,000 before the upward revision. The August private-sector job growth of 38,000 positions fell well below the Dow Jones consensus estimate of 47,000 and also lagged behind the 48,000 jobs that many other economists expected for the month.

    The hiring slowdown affected various industries differently. Education and health services led the August hiring surge with 45,000 new positions. Leisure and hospitality added 16,000 jobs. Construction added 12,000 positions. Financial activities and other services each gained 6,000 jobs. Conversely, manufacturing shed 17,000 positions. Professional and business services lost 16,000 jobs. Natural resources and mining, as well as trade, transportation, and utilities, each lost 5,000 positions. Information services lost 4,000 positions.

    US labor market cooling hits private sector and job openings (2)

    Hiring Trends by Business Size and Region

    Establishment size played a massive role in the August employment outcome. Large businesses with 500 or more employees on their payroll contributed 34,000 of the August gains. Small businesses with fewer than 50 employees added 3,000 jobs. Medium establishments showed zero net change in hiring.

    Regional differences also defined the labor market landscape. The Northeast led the country with 38,000 new positions. The Mid-Atlantic added 26,000 jobs. West North Central saw a gain of 20,000 positions. South Atlantic added 14,000 jobs. New England added 12,000 positions. The East South Central region lost 2,000 jobs. West South Central lost 9,000 positions. The Mountain region lost 3,000 jobs. The Pacific region lost 5,000 jobs. East North Central lost 15,000 positions. The West declined by 8,000 positions, and the South added only 3,000 jobs.

    Wage Growth and Worker Mobility

    Wage growth showed signs of deceleration. For all private-sector workers, base pay rose 3.2% year over year. Gross pay climbed 4.7% for the entire workforce. Job-stayers saw base pay rise 3.0%. Their gross pay grew by 4.4%. Job-changers experienced faster growth, with base pay increasing 4.7% and gross pay rising 7.3%. You should note the difference between base pay and gross pay when evaluating these figures.

    Worker Category Base Pay Growth Gross Pay Growth
    All Workers 3.2% 4.7%
    Job-stayers 3.0% 4.4%
    Job-changers 4.7% 7.3%

    Liv Wang, a lead data scientist at ADP, noted that pay growth has decelerated for four years. Among lower-paid workers, base pay growth remains slower than it was before the pandemic.

    Sector Median Base Pay Change
    Construction 4.0%
    Manufacturing 3.5%
    Financial activities 3.5%
    Professional and business services 3.2%
    Education and health services 3.0%
    Leisure and hospitality 2.9%

    Analyzing JOLTS and Job Openings

    The July 2026 JOLTS data shows job openings reached 7.271 million. This rose from 7.182 million in June. This increase missed market expectations of 7.30 million.

    Month Job Openings (Thousands)
    June 2026 7,182
    July 2026 7,271

    Job openings grew in specific sectors during July. Durable goods manufacturing added 76,000 openings. Health care and social assistance added 54,000. Wholesale trade added 50,000. Construction added 28,000. Job openings fell in transportation, warehousing, and utilities by 67,000. Professional and business services saw a decline of 65,000 openings.

    The Relationship Between Hires and Quits

    Labor demand shows a downward trend. In May 2026, job openings reached 7.594 million. This exceeded the projected 7.280 million openings. In May, there were 7.307 million unemployed workers. This resulted in 1.04 available jobs per unemployed worker.

    The link between quits and layoffs differs from previous economic cycles. During the COVID pandemic, layoffs hit record highs while quits moved in the opposite direction. Since mid-2022, job openings, hires, and quits have all declined. Layoffs and discharges have risen gradually since that time. In July 2026, total hires stood at 5.1 million, and the quits rate fell to 1.9%. This indicates a market in which workers are less willing to leave their jobs voluntarily.

    Federal Reserve Policy and Political Pressure

    The Federal Open Market Committee meets September 15-16, 2026. Chairman Kevin Warsh faces pressure from President Donald Trump. Trump advocates for rate cuts to reduce the cost of borrowing and stimulate growth. He has even threatened to stop trading with countries that maintain trade deficits if the Fed hikes rates.

    Warsh stated that the Fed’s predominant focus remains prices. He suggested a rate hike might be the preferred strategy to combat inflation. Prediction markets show that slightly more than half of participants expect a 25-basis-point hike. Just over 45% believe the Fed will maintain current rates. No market participants expect a rate cut at this meeting.

    The Federal Reserve attempts to balance its dual mandate of price stability and maximum employment. Warsh recently stated at the Jackson Hole Economic Symposium that the responsibility for 65 months of sustained, elevated inflation sits squarely with the central bank. Will the Federal Reserve prioritize inflation or employment at the upcoming meeting?

    Inflation and Price Stability

    Inflation remains above the Federal Reserve’s 2% target. The Consumer Price Index rose 0.1% month over month in July. The year-over-year increase reached 3.4%. Core CPI increased 0.2% month over month and 2.5% year over year.

    The PCE price index, the Fed’s preferred measure, rose 0.2% in July. The year-over-year increase for core PCE stood at 3.3%. These figures show that inflation persists despite moderating trends. Higher long-term yields in the U.S. and other major markets continue to create pressure on the economy.

    The Labor Market Verdict

    The labor market is clearly cooling. ADP’s August report marks the slowest hiring pace since January. Job openings continue to trend downward toward pre-pandemic levels. The unemployment rate remains at 4.1%. The labor force participation rate fell to 61.4% in July. This decline reflected 264,000 people leaving the labor force. Private-sector hiring is weak, and job openings missed expectations.

  • A beginner’s guide to Fanatics Sportsbook’s 2026 NFL alt-line spreads

    A beginner’s guide to Fanatics Sportsbook’s 2026 NFL alt-line spreads

    The NFL reached multi-year commercial agreements with DraftKings, FanDuel, and Fanatics Betting and Gaming ahead of the 2026 season. This non-exclusive arrangement allows Fanatics to expand its existing relationship with the league, which previously included collectibles and official merchandise. Fanatics also becomes an Official Online Casino Marketing Partner of the NFL. All three partners, including Fanatics, access real-time play-by-play statistics, Next Gen Stats, and BetVision through Genius Sports. These agreements permit the use of NFL marks within the sports betting category and allow for presence at events like the Super Bowl and NFL Draft. Fanatics provides a strong platform for fans who prioritize rewards and mobile convenience.

    Moneyline and point spread mechanics

    Moneyline bets task a user with picking which team wins the game. If the New York Jets are -110 to beat the New England Patriots, a bettor must wager $110 to win $100 in profit. Positive odds like +120 for the LA Rams indicate the profit a bettor wins on a $100 wager. Point spread bets create a handicap to even the odds between teams of different strengths. If the Las Vegas Raiders play the Pittsburgh Steelers with a seven point handicap, the app displays "Raiders +7" and "Steelers -7." A bet on the Raiders wins if Las Vegas wins or loses by fewer than 7 points. If the Steelers win by exactly seven points, the result settles as a push.

    A beginner's guide to Fanatics Sportsbook's 2026 NFL alt-line spreads (2)

    The math for these spreads remains consistent across major platforms. If the Kansas City Chiefs are -5.5 on the spread at -110 and the Las Vegas Raiders are +5.5 on the spread at -110, the sportsbook takes a cut. If the Chiefs win by six points, they cover the spread. If the Chiefs win by five points or less or lose the game, they fail to cover the spread. If the Raiders lose by five points or less or win the game, they cover the spread. If both sides are priced at -110, bettors must risk $110 to win $100.

    Totals and player performance markets

    Totals bets focus on whether the combined score of both teams stays above or below a set line. For a Green Bay Packers game against the Jacksonville Jaguars with a 44.5 line, a bet on the over pays out if the total score reaches 45 or more. Bettors can also choose different lines to find a better fit for their predictions. These markets focus on the offensive and defensive flow rather than the final winner.

    Player props shift the focus to individual statistics during a game. Bettors can wager on quarterback passing yards, running back rushing yards, or receiver receptions. Markets also exist for defensive players regarding interceptions or sacks. Kickers also participate in these markets through field goal props. These options allow users to leverage knowledge about specific player matchups and defensive vulnerabilities. A bettor might look at a star quarterback facing a weak secondary to find value in passing yards.

    Understanding the vig and juice

    The vig, or juice, is the commission a sportsbook builds into every wager to ensure long-term profitability. Sportsbooks price odds slightly below fair value to create this margin. On traditional point spread and totals markets priced at -110 on both sides, the vig equals approximately 4.76%. This margin means a bettor must win 52.38% of bets to break even rather than 50%. Higher margins often exist in player props, specials, and same-game parlays.

    To minimize this impact, bettors shop for lines and use reduced-juice promotions. Fanatics provides reduced-juice markets for selected games, often pricing selections at -105 instead of -110. This lower commission requires a smaller win percentage to break even. If the LA Rams are -150 favorites against the LA Chargers, the Rams have a 60% implied win probability. The Chargers at +130 have a 43.5% implied win probability. This results in a 3.5% vig for the sportsbook.

    Metric Fanatics Sportsbook FanDuel BetMGM DraftKings
    Rating 4.7/5 4.8/5 4.8/5 4.7/5
    Welcome Bonus Up to $1,000 FanCash Up to $350 bonus bets Up to $1,500 bonus bets Bet $5, get $200
    Minimum Deposit $10 $5 $10 $5
    Payout Speed Within 24 hours Within 24 hours Within 24 hours Within 24 hours

    Parlays and same game parlays

    A parlay wager combines two or more individual bets into a single ticket. Every leg on a parlay ticket must win for the entire bet to cash. If even one selection loses, the whole parlay loses. Parlays offer the potential for larger payouts compared to placing bets individually. This high-risk, high-reward structure attracts bettors who want to turn a modest stake into a substantial return.

    Same-game parlays allow users to combine several bets from a single NFL game into one ticket. This can include a point spread bet, a rushing yards prop, and a totals bet. For a game between the Kansas City Chiefs and Las Vegas Raiders, a user might bet on a Chiefs win, Travis Kelce to get four or more receptions, and Patrick Mahomes to throw for over 200 yards. All three outcomes must pass for the bet to pay out. A teaser acts as a parlay of at least two legs where a user can alter the point spread or total by a fixed amount.

    Round-robin parlay betting provides another way to structure multiple selections. A customer can place a series of wagers from a larger group of selections. For example, a customer might place three parlays covering two selections from an overall group of three. If two of these selections win, the customer has at least one winning bet. Round-robin wagers cannot include selections from the same event.

    FanCash rewards and welcome bonuses

    Fanatics provides a unique rewards ecosystem through FanCash. New customers in several states, including Arizona, Colorado, and Illinois, can claim the welcome offer of up to $1,000 in FanCash by placing qualifying daily wagers over their first ten days of account activity. This promotion allows users to match their qualifying daily wager up to $100 per day for the first 10 days. Qualifying wagers must have minimum odds of -200.

    The FanCash rewards system integrates directly with the Fanatics merchandise site. Bettors earn FanCash on every wager they place. The percentage of rewards depends on the odds of the bet. Bettors earn between 1% and 3% on odds between -109 and +950. They earn between 3% and 6% on odds between +951 and +3200. They earn between 6% and 9% on odds between +3201 and +7000. Bets with odds between +7001 and +9000 earn between 9% and 10%.

    Other promotional options exist depending on the state. In Illinois and New York, users can receive 10x 100% profit boost tokens instantly. In Vermont, users can get up to $1,000 in FanCash. In most other eligible states, a promo code like FOX350 allows users to bet $20 and get $350 in bonus bets, paid as $50 per day for seven days. You should monitor your betting history within the app to track these rewards.

    App interface and banking limitations

    The Fanatics mobile app is the only way to access the sportsbook. It is available on the Apple App Store and Google Play Store. The app has a modern design. It uses an intuitive navigation bar. This bar gives immediate access to rewards and popular markets. The interface tracks betting history. It also shows tailored markets based on user preferences.

    Users can fund accounts using debit cards, PayPal, Venmo, Apple Pay, online banking, PaySafe Cash, or wire transfers. Most methods process instantly. PayPal and Venmo typically process withdrawals within a few hours. Wire transfers take two to three days. The app includes a withdrawal tracker to show the status of payouts in real time.

    The limited banking options and slow withdrawal speeds are frustrating when using Fanatics. The app lacks a desktop site, which prevents users from researching on a laptop. This mobile-only model is a disadvantage for those who prefer larger screens. Will the lack of a desktop site eventually hinder Fanatics as more veteran bettors return to computer-based platforms?

    Integrity and regulation

    The NFL integrity program uses collaboration with betting partners and monitoring through Genius Sports. Dedicated Integrity Representatives, who are often retired law enforcement officers, work with each club to protect the game. All partners must adhere to policies that prohibit wagers tied to officiating or injuries.

    Fanatics must follow state-level regulations. In Michigan, the Michigan Gaming Control Board oversees operations. In Colorado, Fanatics paid a $20,000 fine after a VIP host contacted a self-excluded gambler twice. This fine followed an agreement with the Colorado Limited Gaming Control Commission. The company also agreed to audit its self-exclusion list.

    All users must be at least 21 years old. Responsible gaming tools like deposit limits, wager limits, and time limits are available in the app. Self-exclusion options allow users to close their accounts for a minimum of one year. Fanatics protects user data with 256-bit SSL encryption and multi-factor authentication.

  • Apple shifts AI processing to the device

    Apple shifts AI processing to the device

    Apple handles most AI tasks on the device itself to keep user data private. The company uses its own silicon to run generative models locally on the iPhone, iPad, and Mac. This approach means the phone processes the information using its own processor without needing a cloud connection for basic tasks. For more complex requests that require larger foundation models, Apple uses Private Cloud Compute. This system uses custom-built server hardware in Apple data centers to run AI workloads. Apple designed this cloud system to ensure that personal user data remains inaccessible to anyone other than the user, including Apple staff.

    The A18 Pro chip powers this on-device intelligence. This 3-nanometer chip includes a 16-core neural engine with 35 TOPS of theoretical performance. It uses two Everest cores running at 4050 MHz and four Sawtooth cores running at 2420 MHz. These chips provide the 8 GB of RAM required to handle the intensive processing for Apple Intelligence. Earlier models like the iPhone 15 only have 6 GB of RAM, which might not be sufficient for these large language models.

    Component Specification
    Chipset A18 Pro
    Process 3 nanometers
    Neural Engine 16-core
    NPU Performance 35 TOPS
    RAM 8 GB LPDDR5X
    CPU Cores 6 (2 Everest, 4 Sawtooth)
    GPU Cores 6
    GPU Frequency 1490 MHz

    The MacBook Neo also uses the A18 Pro chip. This entry-level laptop costs $599 and includes a 16-core Neural Engine to support on-device AI tasks. It provides 16 hours of battery life and features a 1080p FaceTime HD camera. While the A18 Pro supports AI, the MacBook Neo lacks the M5 chips found in the MacBook Air. The M5 Pro and M5 Max chips handle AI tasks up to 4 times faster than the M4 predecessors.

    Siri AI adds new capabilities

    Siri AI acts as a more capable assistant through deep integration across Apple products. This new version of Siri draws on personal context to search messages, emails, and photos. It also performs systemwide app actions. Users can ask Siri to answer questions about content on their screen or search the web for up-to-date information. A dedicated Siri app allows users to restart or revisit conversations. iCloud syncs this conversational history privately across devices.

    The integration with third-party models changes how Siri functions. Apple uses Google’s Gemini models to power certain Apple Intelligence features. This collaboration helps Apple provide advanced chatbot capabilities. Apple is also discussing adding Google’s Gemini as an additional option later this year. This follows the existing partnership where ChatGPT assists with complex or creative requests. When Siri directs a question to ChatGPT, the user does not see the request history in their ChatGPT app.

    I find the lack of ChatGPT history frustrating.

    The writing tools in iOS 18 and macOS 15 provide immediate utility. These tools help users proofread, rewrite text in different tones, or summarize content. This functionality works well for professional or friendly messaging. However, some features like Genmoji take a long time to create. You might wait several minutes for a single emoji.

    Hardware requirements for intelligence

    Not every iPhone runs the full suite of Apple Intelligence features. The software requires specific hardware to manage the heavy processing loads. On-device AI tasks specifically require an iPhone 15 Pro or later. You also need an iPad with an M1 chip or later to run these features. The MacBook Neo, which uses the A18 Pro, also supports these capabilities.

    Device Model AI Compatibility
    iPhone 15 Pro Supported
    iPhone 15 Pro Max Supported
    iPhone 16 series Supported
    iPad (M1 or later) Supported
    MacBook Neo Supported
    iPhone 14 Not supported for on-device AI
    iPhone 13 Not supported for on-device AI

    The iPhone 16 series includes a camera control button. This button allows users to activate Visual Intelligence. This feature uses the camera and Siri to identify objects. This hardware-based approach differs from the iPhone SE, which is expected to use the A18 chip but will lack the camera control button. This means the SE will not have access to Visual Intelligence. The SE will instead feature a 6.1-inch OLED screen and Face ID, replacing the Home button.

    The A18 chip provides enough power for the upcoming iPhone SE. This device will likely cost $499. It includes USB-C and MagSafe for charging. While it lacks the camera control button, the A18 chip ensures the device can run Apple Intelligence.

    Privacy and cloud processing

    Apple relies on on-device processing to keep user data disaggregated. Data that stays on the device is not subject to centralized attacks. When the device needs more power, it sends requests to Private Cloud Compute. This system uses a hardened operating system to protect privacy. It uses code signing and sandboxing to limit the attack surface.

    Apple collaborates with Google and NVIDIA to expand this infrastructure. They use NVIDIA GPUs and Google Cloud to run more complex workloads. This expansion allows for agentic tool-use and complex reasoning. Apple maintains control over the software in these data centers. Devices only trust Private Cloud Compute software that Apple cryptographically approves.

    The company uses several methods to secure the cloud. It uses a verifiable, append-only ledger to track Google Cloud hardware in the PCC fleet. It also uses software attestation rooted in two separate independent vendors. This prevents attackers from easily accessing user data through the supply chain.

    Does the reliance on third-party data centers like Google Cloud weaken the privacy of Private Cloud Compute?

    The M5 Pro and M5 Max chips in the new MacBook Pro models also improve AI handling. These chips are designed for intensive tasks. The M5 Pro supports 64GB of unified memory. The M5 Max supports 128GB of unified memory. These higher memory capacities help the system manage the large models used in AI. The M5 Pro provides up to 30% better performance for pro workloads than the M4 Pro. The M5 Max provides up to 8x faster AI image generation than the M1 Pro.

  • Snowflake vs Databricks: The 2026 AI lakehouse race

    Snowflake vs Databricks: The 2026 AI lakehouse race

    Databricks reached $5.4 billion in annualized recurring revenue in February 2026, while Snowflake reported $4.68 billion in total revenue for fiscal year 2026. This competition defines the current cloud data market. Databricks wins for heavy machine learning, engineering, and real-time streaming. Snowflake wins for SQL-first analytics, business intelligence, and managed simplicity.

    Architecture and the AI battle

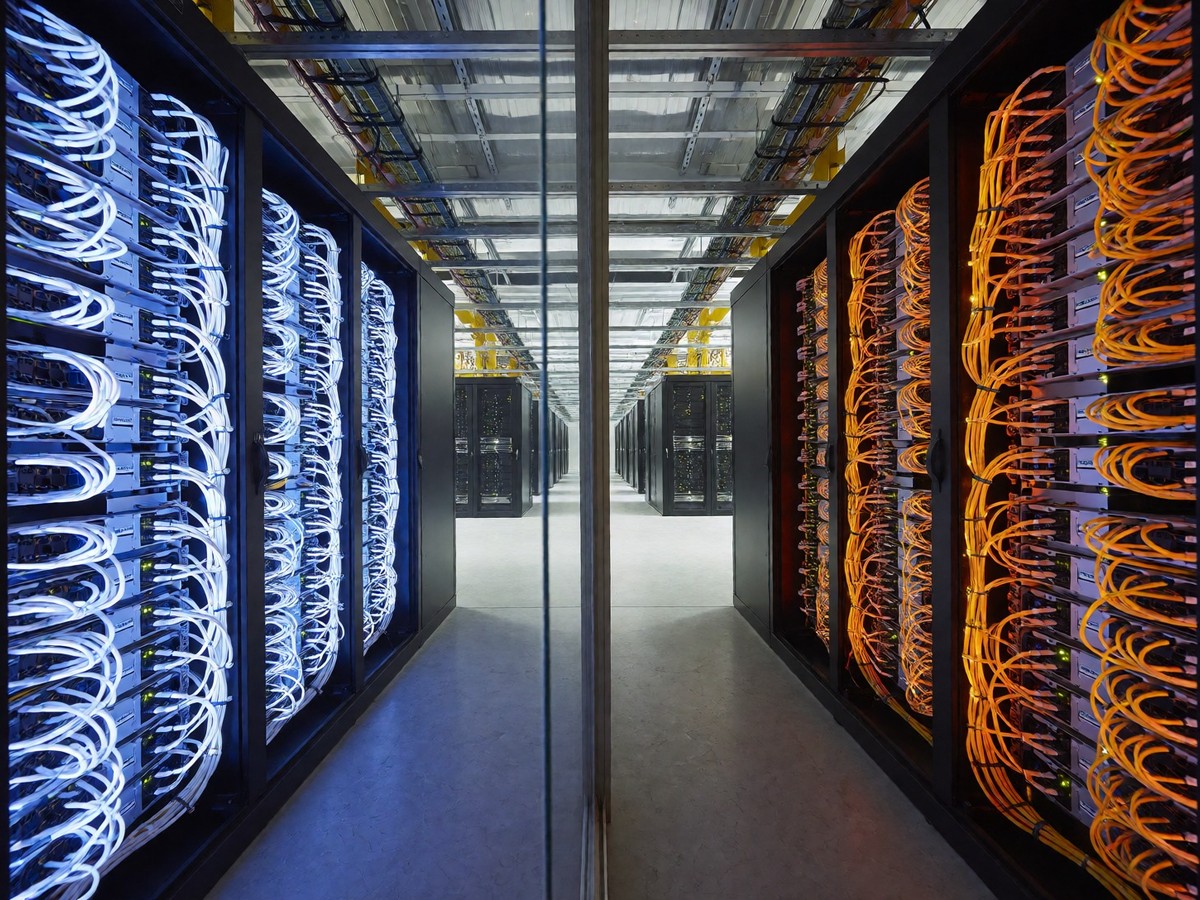
    Databricks uses a lakehouse architecture that stores data in open formats like Delta Lake and Apache Iceberg on cloud object storage. It runs compute on Apache Spark clusters. The Photon engine, a native C++ execution layer, accelerates SQL and DataFrame operations. Databricks also released Lakebase in 2026, which is a serverless PostgreSQL offering. This allows users to run transactional OLTP workloads inside the same Unity Catalog governance layer used for the lakehouse.

    Snowflake uses a multi-cluster shared data architecture. It separates storage, compute, and cloud services into three layers. Data stays in proprietary compressed columnar format in cloud-managed storage. Virtual warehouses serve as independent compute clusters that scale horizontally. Snowflake delivers 15% to 30% faster query response times for typical BI workloads than Databricks SQL Warehouses.

    The integration with NVIDIA changes how these platforms handle Large Language Models. Snowflake integrated NVIDIA NeMo Retriever microservices into Cortex AI. This enables the connection of custom models to business data. Snowflake Arctic, an LLM with 480 billion total parameters, is available as an NVIDIA NIM inference microservice. Databricks DBRX is a 132 billion parameter model that uses a fine-grained Mixture of Experts architecture. DBRX was trained on 3,072 NVIDIA H100 GPUs and cost approximately $10 million. Snowflake Arctic used 1,000 NVIDIA GPUs and cost approximately $2 million to develop.

    Feature Snowflake Arctic Databricks DBRX
    Total Parameters 480 Billion 132 Billion
    Active Parameters 17 Billion 36 Billion
    Training Budget $2 Million $10 Million
    Training Tokens 3.5 Trillion 12 Trillion
    GPU Count 1,000 3,072

    Databricks provides an intuitive API to fine-tune DBRX. Snowflake Arctic uses a LoRA-based fine-tuning pipeline.

    Workload routing and performance

    Databricks is the strategic choice for complex data engineering and machine learning. Its platform includes MLflow for experiment tracking and Mosaic AI for building RAG applications. The platform allows users to train models on the same data they use for analytics without moving it. For large-scale ETL on petabyte-scale datasets, Databricks runs 20% to 40% more cheaply than Snowflake.

    Snowflake is the pragmatic choice for analysts. It provides a polished SQL-native experience with minimal operational overhead. The platform excels at high-concurrency, short-query workloads. If fifty analysts hit the same dashboard at once, Snowflake’s multi-cluster warehouses scale without queue delays.

    The two platforms are converging. Snowflake added Snowpark for Python and Java developers. Databricks launched Databricks SQL to compete with Snowflake’s BI use cases.

    How much does the human cost of management affect your final budget?

    Pricing and total cost of ownership

    Both companies use consumption-based pricing. Snowflake charges per credit, with warehouses consuming 1 to 8 or more credits per hour. Storage costs approximately $23 per TB per month. Databricks charges per Databricks Unit (DBU). Users also pay their cloud provider for the underlying infrastructure, such as VMs and networking. This dual-billing model makes Databricks cost estimation difficult. Infrastructure can add 50% to 200% on top of DBU charges.

    Snowflake is dramatically cheaper to develop, manage, and operate. Organizations report 20% to 40% higher costs for equivalent workloads when compared to well-optimized Databricks deployments. Databricks requires deep Spark knowledge to avoid burning money.

    Cost Element Snowflake Databricks
    Compute Unit Credit ($1.50 – $4.00) DBU ($0.22 – $0.70)
    Storage (per TB/month) ~$23 Cloud Provider Rate
    Pricing Model Usage-based credits DBU + Cloud Infrastructure

    Databricks is better for large-scale processing. Snowflake is better for predictable, managed scaling.

    Governance and the agentic era

    Databricks manages governance through Unity Catalog. It provides unified governance across structured data, unstructured files, ML models, and AI assets. Unity AI Gateway extends this to models, agents, and cost controls. The platform also offers Agent Bricks, which provides a platform for model choice, secure sandboxes, and evaluation.

    Snowflake uses Horizon governance. It provides a managed-service model that appeals to enterprises wanting strict data governance. Snowflake’s data sharing is more developed, allowing users to expose live data to other accounts without duplication via zero-copy sharing.

    Databricks released Lakeflow in 2026 to support ingestion, transformation, and orchestration. It also introduced Lakebase to handle transactional writes. This removes the need for separate systems.

    Snowflake provides a high-performance variant of Snowpipe Streaming. It supports up to 10 GB per second ingestion with sub-10-second latency. Databricks uses Structured Streaming to process data with exactly-once guarantees.

    Databricks handles machine learning better. Use Databricks for engineering and AI. Use Snowflake for analytics and BI.

  • Deploying Claude 3.5 Sonnet via Amazon Bedrock

    Deploying Claude 3.5 Sonnet via Amazon Bedrock

    Claude 3.5 Sonnet costs $3 per million input tokens and $15 per million output tokens. This model provides a 200K token context window. Anthropic retired the two previous Claude 3.5 Sonnet snapshots, claude-3-5-sonnet-20240620 and claude-3-5-sonnet-20241022, from its first-party API on October 28, 2025. Organizations using Amazon Bedrock to access Claude 3.5 Sonnet operate under specific constraints. AWS places these organizations in the Start tier. These users do not move between usage tiers automatically. To increase limits, users must contact an Anthropic account representative or Anthropic support.

    Feature Specification
    Input Token Price $3 per million
    Output Token Price $15 per million
    Context Window 200K tokens
    Prompt Caching Supported on Amazon Bedrock
    Max Output (via Batch API) 300K tokens

    Automating development with Claude Code

    Claude Code operates directly in a terminal or in IDEs like VS Code and Jetbrains. It uses Claude Sonnet 4 to write code and fix bugs across multiple files. The tool can search through git history, resolve merge conflicts, and create commits or PRs. It also works with AWS CLI, Terraform, and k8s. Developers can connect Claude Code to external tools and data sources through the Model Context Protocol.

    Amazon Bedrock prompt caching provides performance benefits for these agentic applications. When a user enables prompt caching, the application inserts cache checkpoint markers at specific points in prompts. Amazon Bedrock creates cache checkpoints that save the model state after processing the preceding text. Subsequent requests that reuse the same prefix load the cached state instead of recomputing. This process reduces response times and lowers input token costs.

    For complex codebases, prompt caching reduces token costs for repeated interactions with the same files. In one test, using prompt caching for a simple task resulted in lower resource consumption than running the same task without it. To test this, developers set the environment variable DISABLE_PROMPT_CACHING to enable the feature. To disable it, developers set the variable to true. Does the reduction in latency justify the management of cache checkpoint markers?

    Managing API limits and costs

    The API enforces service-configured limits at the organization level. Users can also set user-configurable limits for organization workspaces. Two types of limits exist: spend limits and rate limits. Spend limits set a maximum monthly cost an organization incurs for API usage. Rate limits set the maximum number of API requests an organization makes over a defined period.

    The API uses the token bucket algorithm for rate limiting. This means capacity replenishes up to a maximum limit rather than resetting at fixed intervals. Rate limits for the Messages API measure requests per minute (RPM), input tokens per minute (ITPM), and output tokens per minute (OTPM). For most Claude models, only input tokens after the last cache breakpoint count toward ITPM. Cached input tokens do not count toward ITPM for most models. Instead, they bill at the cache read rate, which is a fraction of the base input price.

    If an organization reaches its spend cap, API usage pauses until 00:00 UTC on the first day of the next month. Using the API during this pause returns an HTTP 429 error with the code enforced_spend_limit_reached. You can view your current limits in the Claude Console.

    Implementation for enterprise workflows

    Claude 3.5 Sonnet performs tasks like code translation and advanced image analysis. It converts code between languages, such as translating Python to Java, while preserving original logic. The model also transcribes text from imperfect images. It extracts information from documents containing printed text, handwritten notes, and custom logos.

    You can use Claude 3.5 Sonnet for context-sensitive customer support and multi-step workflow orchestration. For developers, the model solves coding problems with sophisticated reasoning. In an internal agentic coding evaluation, Claude 3.5 Sonnet solved 64% of problems. This outperformed Claude 3 Opus, which solved 38% in the same evaluation.

    Deployment on AWS requires planning for security and governance. Organizations should use AWS IAM Identity Center to govern identity and access. This verifies that only authorized developers access Claude Code. Developers can use temporary, role-based credentials through this method.

    The model’s audio capabilities are non-existent. Anthropic provides no native audio input, speech output, or real-time voice in its API. Enterprise voice stacks using Claude require third-party speech-to-text and speech-to-text components.

    The following table compares the current Claude model lineup.

    Model Latency Pricing (Input/Output per MTok) Context Window
    Claude Fable 5.1 Slower $10 / $50 1M tokens
    Claude Opus 5 Moderate $5 / $25 1M tokens
    Claude Sonnet 5 Fast $2 / $10 1M tokens
    Claude Haiku 4.5 Fastest $1 / $5 200K tokens

    Organizations must review service quotas and set appropriate Token Per Minute (TPM) and Request Per Minute (RPM) values based on active developer counts. For 200 developers, a request for 20,000 TPM per developer would total 4 million total TPM. Use the /cost command in Claude Code to monitor resource consumption and API processing time.

  • Nvidia Blackwell Ultra supply bottleneck and manufacturing constraints

    Nvidia Blackwell Ultra supply bottleneck and manufacturing constraints

    Nvidia faces a manufacturing squeeze because TSMC’s CoWoS-L packaging capacity remains the primary constraint for Blackwell Ultra production. While TSMC aims to reach 130,000 CoWoS wafers per month by late 2026, the company remains fully booked with lead times between 52 and 78 weeks. Nvidia holds roughly 60% of this capacity, claiming 510,000 CoWoS wafers specifically for CoWoS-L. This concentration leaves Broadcom with 15% and AMD with 11%.

    The shortage stems from physical assembly needs rather than wafer fabrication. TSMC can etch more GPU dies than it can package. A GPU requires both a CoWoS slot and HBM stacks. Solving one alone moves nothing. Extra HBM with no packaging capacity results in inventory. Extra packaging capacity with no HBM results in idle line time.

    Thermal management issues also plague the Blackwell architecture. A mismatch in the coefficient of thermal expansion among the GPU chiplets, the LSI bridges, the RDL interposer, and the motherboard substrate causes warping and system failure. Nvidia had to redesign the top metal layers and bumps of the GPU silicon to improve yields. This redesign forces a requalification process with TSMC before mass production begins.

    Component 2026 Status Lead Time
    CoWoS-L Fully booked 52 – 78 weeks
    HBM3e Sold out N/A
    HBM4 Ramping N/A
    N3 Logic Tight 52 – 78 weeks

    Memory and hyperscaler demand

    High Bandwidth Memory (HBM) availability creates a second bottleneck. HBM3e is sold out for 2026, with prices increasing by double digits year-over-year. SK Hynix supplies approximately 62% of Nvidia’s HBM4 and roughly two-thirds of its HBM3e. This supply concentration forces Nvidia to rely on a single primary partner to meet its roadmap.

    Microsoft is attempting to reduce its dependence on Nvidia by building custom silicon. Microsoft is in discussions with TSMC to secure manufacturing capacity for over 300,000 Maia 300 chips for 2027 delivery. This follows the January launch of the Maia 200. Microsoft aims to produce gigawatts of capacity through these custom chips.

    Large cloud providers also consume the remaining supply through massive forward orders. Microsoft, Google, Meta, and Amazon placed multi-billion-dollar orders for Blackwell GPUs in 2025. These orders consume most of the available allocation through 2026 and 2027. These commitments crowd out mid-market and enterprise customers who previously bought through standard channels.

    I find the reliance on a single packaging technology for the entire roadmap risky. If TSMC cannot resolve the warping issues in CoWoS-L, the entire Blackwell ramp stalls.

    Blackwell Ultra specifications

    Blackwell Ultra targets the AI factory market using a dual-reticle design. This design connects two reticle-sized dies using the NVIDIA High-Bandwidth Interface, which provides 10 TB/s of bandwidth. The chip utilizes TSMC 4NP manufacturing and contains 208 billion transistors.

    The memory subsystem in Blackwell Ultra provides 288 GB of HBM3e per GPU. This capacity represents a 3.6x increase over the H100 and a 50% increase over the original Blackwell. The total bandwidth reaches 8 TB/s per GPU, which is a 2.4x improvement over the H100’s 3.35 TB/s.

    Feature Blackwell Ultra Spec
    Transistor Count 208B
    Memory Capacity 288 GB HBM3e
    Memory Bandwidth 8 TB/s
    Tensor Cores 640 (5th Gen)
    NVFP4 Compute 15 PetaFLOPS
    TDP 1,400W

    The architecture includes 160 Streaming Multiprocessors organized into eight Graphics Processing Clusters. Each SM contains four fifth-generation Tensor Cores. These cores use the second-generation Transformer Engine to handle NVFP4 precision. This format reduces the memory footprint by 1.8x compared to FP8.

    The Blackwell Ultra also doubles the throughput for key instructions in the attention layer. This change allows for 2x faster attention-layer compute compared to previous Blackwell models. This modification targets reasoning models that use large context windows.

    The competitive landscape

    AMD and custom silicon designs challenge Nvidia’s market position. AMD’s MI325X delivers competitive results against Nvidia’s H100 for certain inference workloads. AMD’s chips deliver 40% more tokens per dollar on LLM inference workloads compared to Nvidia.

    Hyperscalers are moving toward self-sufficiency to lower costs. Microsoft’s Maia 200 offers 30% better performance per dollar than the latest generation hardware in its current fleet. Google uses its own TPUs, and Amazon utilizes its own Trainium and Inferentia chips. These custom solutions reduce the high-margin sales available to Nvidia from its largest customers.

    The software ecosystem remains Nvidia’s main defense. CUDA provides the programming model for GPU-accelerated computing and has a two-decade head start. Every major deep learning framework like PyTorch and TensorFlow uses CUDA as a native backend. Switching to AMD’s ROCm requires migrating every application, library, and operational workflow.

    Can Nvidia maintain its valuation if custom silicon replaces its primary customers?

    The market currently views the Blackwell supply issues as a temporary manufacturing hurdle. However, the combination of TSMC packaging limits and the aggressive custom silicon programs at Microsoft and Google creates a difficult environment for Nvidia to sustain its growth rates. The company must manage the transition to CoWoS-L without letting its leading-edge customers migrate to in-house alternatives.

  • The Dyson hair tech monopoly fight

    The Dyson hair tech monopoly fight

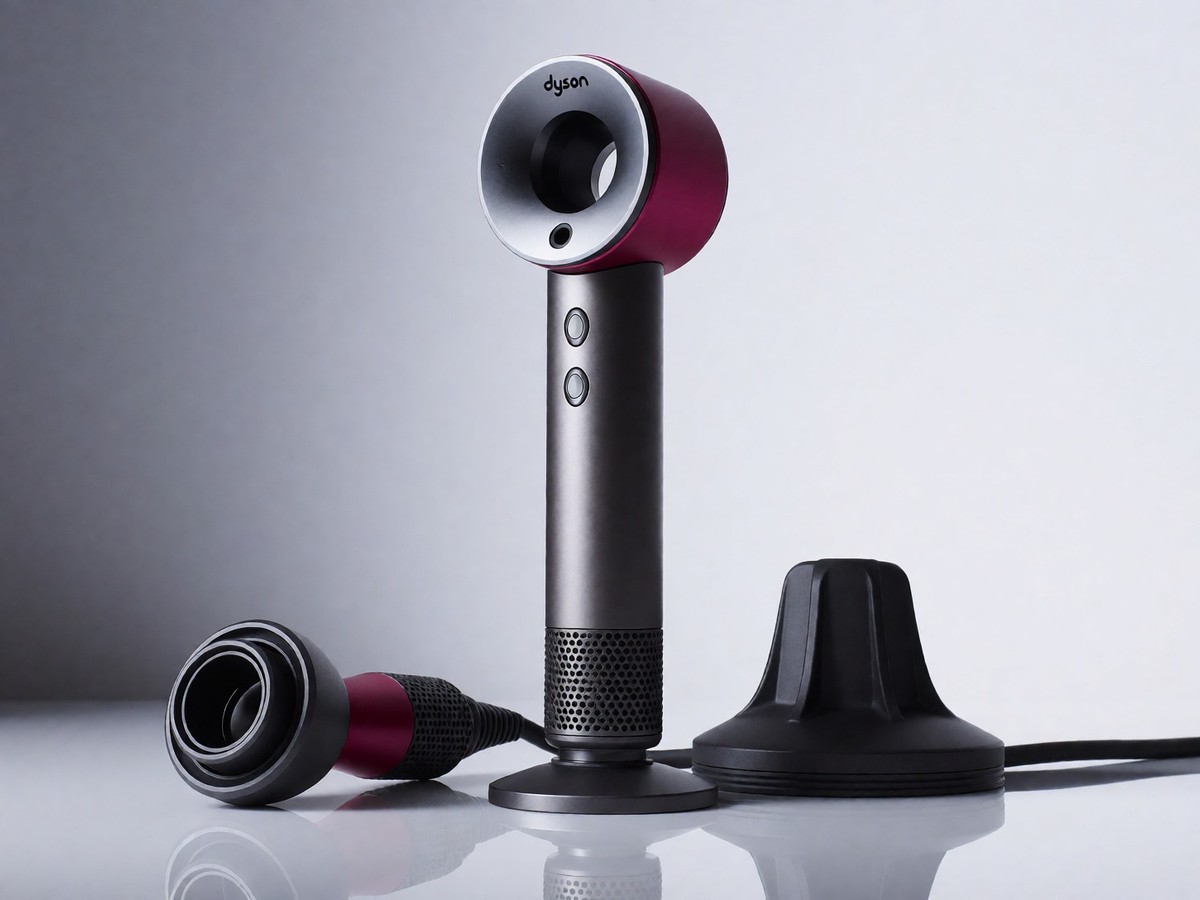
    Dyson launched the Supersonic hair dryer in 2016 for over $400. This tool uses a motor in the handle to balance the device, weighing approximately 1.2 to 1.4 pounds. The engineering uses a glass bead thermistor to measure air temperature 20 times every second, ensuring the heat does not exceed 150 degrees Celsius. A wide-tooth comb, flyaway smoother, styling concentrator, gentle air attachment, and diffuser come in the box.

    Dyson mastered air manipulation. The brand spent $100 million on haircare lab research and $32 million on the Corrale straightener. The Corrale uses flexing plates with active cooling to dry hair without excessive heat exposure. This new technology arrives alongside the Airsmooth dryer brush, which retails for $249 and launches on September 8. The Corrale CoolShine straightener costs $329 and hits shelves on September 15.

    Product Price Key Feature
    Supersonic $400 Magnetic attachments
    Airwrap $550 Coanda effect
    Corrale $500 Cordless flexibility
    Corrale CoolShine $329 Active cooling plates
    Airsmooth $249 Dual-bristle technology
    Airstrait Variable Air flow straightening

    Dyson also released the first toothbrush, which costs $499 and uses AI-powered vision to find gaps between teeth. This tool brushes, liquid flosses, and dispenses mouthwash.

    Shark and the patent defense

    Shark entered the premium market with the FlexStyle, a multi-styler that uses the same Coanda effect as Dyson. The FlexStyle allows users to dry, blow out, or curl hair. It includes two barrels for left and right curling, though newer editions use one barrel that switches directions with a lever. The FlexStyle costs significantly less than the $600 Dyson Airwrap.

    Dyson cannot claim a total monopoly. A legal battle between Dyson and SharkNinja ended in 2018 after Dyson voluntarily dismissed its appeal. Dyson originally sued SharkNinja in February 2014, seeking $200 million in damages and a broad injunction. The suit claimed the Shark Rocket vacuum line infringed on three U.S. design patents. Judge Robert M. Dow rejected Dyson’s theory of overall shape similarity. He ruled that the Shark Rockets have a substantially different ornamental appearance.

    Shark’s FlexStyle works well as a hair dryer because it includes an adjustable diffuser. The Airwrap lacks a diffuser capable of keeping fragile curls frizz-free. The FlexStyle handle swivels into a shape resembling the number seven during drying. You might find the FlexStyle better for your budget if you have student loans or prefer to save money for other expenses.

    L’Oreal and the infrared challenge

    L’Oreal Professionnel challenges Dyson’s dominance with the AirLight Pro. This dryer uses infrared light technology for targeted, even heating. This technology provides a customized experience without excess heat loss. The AirLight Pro provides a faster dry time than traditional tools.

    The AirLight Pro offers a competitive price point compared to other premium dryers. It underwent testing to ensure it lasts for 10 years of usage. Some users prefer the AirLight Pro because it provides zero heat damage.

    Dyson’s Supersonic remains a solid choice for people who want a high-end dryer. It reduces drying time and protects gray hair from looking brassy. The magnetic attachments make it easy to swap tools without screw-in parts. However, no one needs to spend $400 on a dryer unless they truly will not miss the money. The Supersonic is not for everyone.

    Patent battles in China and Europe

    Dyson faces intense competition in international markets. In China, design patents for the Supersonic expired in 2024. This expiration allowed many look-alike products to flood the market on platforms like Taobao. These products resemble the Supersonic but cost much less.

    The company also fights Dreame Technology over the Airwrap. Dyson filed a patent infringement action before the Unified Patent Court in May 2025. The court granted a preliminary injunction against Dreame’s Airstyle and Pocket Hair Styler in August 2025. On March 6, 2026, the UPC Court of Appeal extended the injunction, stating the redesigned Dreame products still likely infringe on Dyson’s patent EP3119235.

    The dispute involves a legal question about the "anchor defendant" theory. Dyson argues that appointing an Authorized Representative in Europe allows the UPC to hear claims against non-EU manufacturers like Dreame. The Court of Justice of the European Union must now decide this issue. This ruling will affect how European courts handle overseas companies.

    Will the court allow Dyson to control foreign manufacturers through local representatives?

    Dyson continues to expand its lineup. The brand recently released the R3 Nurovi Spot Plus Scrub UV, a wet-and-dry robot vacuum costing $1,199. It uses a 12-point system to apply water heated to 158 degrees Fahrenheit. This tool helps remove stubborn stains using AI to identify 200 types of substances.

  • Newcastle’s youth gamble versus Villa’s profit machine

    Newcastle’s youth gamble versus Villa’s profit machine

    Newcastle United faces a complex financial crossroads as their strategic approach to squad building shifts. The club’s recent transfer activity signals a departure from the massive spending seen immediately after the 2021 takeover. While the Public Investment Fund (PIF) spent £404.7m during the first three years of ownership, the club only brought in £50.4m from player sales. This imbalance forced the club to confront the reality of Profit and Sustainability Rules (PSR). They also entered a three-year settlement with UEFA to address breaches of financial sustainability regulations. Now, the club relies on player sales and a focus on younger talent to maintain stability.

    The Newcastle spending gap

    Newcastle’s revenue reached £335.3m in their most recent accounts, a massive increase from the £140.2m recorded during the final full campaign of Mike Ashley’s ownership. However, the club’s net spend across the period from 2021-22 to 2023-24 hit £408m. This spending placed them fifth in England. Last summer, the club saw a net spend of £141m on transfers, or an estimated £260m on a gross basis. This figure included the British record sale of Alexander Isak to Liverpool for £125m. Despite this significant income, the club still spent heavily on new arrivals.

    Newcastle's youth gamble versus Villa's profit machine (2)

    The numbers differ.

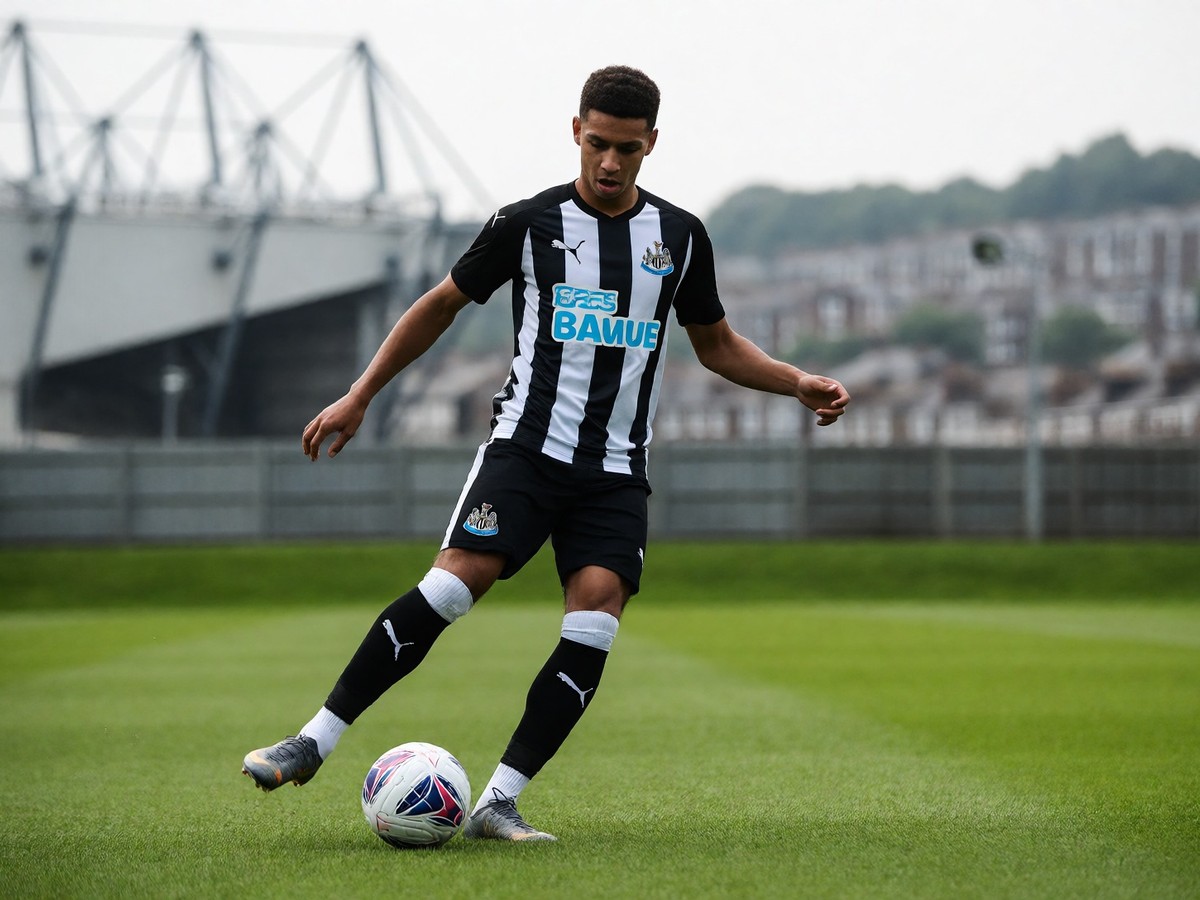
    The club’s focus on youth became evident this summer. They spent more than £100m on players aged 20 or younger. This includes goalkeeper Ewen Jaouen, midfielders Sean Steur and Aladji Bamba, and winger Bazoumana Toure. This investment follows a previous five-season period where the club spent approximately £75m on players aged 20 or younger. These arrivals lack the immediate experience of previous signings like Sven Botman. The club also faced a bruising 12th-place finish last season after missing out on European football.

    Villa’s academy profit engine

    Aston Villa uses player trading to fuel their pursuit of the Premier League elite. The club’s academy generated more than £200m through sales in the last five years. They sold Jack Grealish to Manchester City for over £100m in 2021. The club also sold Jaden Philogene and Cameron Archer to manage costs. These homegrown sales deliver pure profit for the club. This strategy helps them stay within the rules.

    The club’s ability to sell players remains their primary method for competing. This summer, Villa saw Morgan Rogers depart for Chelsea for a record £117m. This deal included an initial £8m fee and £7m in potential add-ons from Middlesbrough. They also sold Youri Tielemans to Manchester United for £35m. Other departures included Moussa Diaby to Al Ittihad for £50m and Jhon Duran to Al Nassr for £65m. They also moved Douglas Luiz to Juventus for £42.5m.

    Villa’s squad building involves selling players to comply with UEFA and Premier League rules. The club recently sold Jacob Ramsey to Newcastle United for £39m, a deal that provided pure profit because he is an academy product. They also sold Lucas Digne to Paris Saint-Germain for £8m, Lewis Dobbin to Southampton for £9m, and Donyell Malen to Roma for £23m. These sales help manage the squad cost constraints.

    New rules change the game

    You already know the basics of these rules. The Premier League replaced PSR with the Squad Cost Ratio (SCR) system. This rule allows clubs to spend a maximum of 85 per cent of their football revenue on squad costs. These costs include player wages, amortised transfers, and agents’ fees. Villa’s revenue reached £378m during their last Champions League campaign, which allowed for an SCR spend of £265m. Newcastle’s SCR budget ranks ninth in the league at £243m.

    The SCR system introduces new thresholds for compliance. A club stays within the green threshold if they spend up to 85 per cent of their revenue. If a club exceeds the red threshold, which is 30 per cent above the green threshold, they face a fixed six-point deduction. This penalty increases by one point for every £6.5m spent over the red threshold. Compliance involves assessments on March 1 and monitoring in October.

    The club must also manage its liquidity and working capital. The Premier League requires clubs to demonstrate they can manage required outgoings and unforeseen fluctuations. This includes a liquidity headroom test that accounts for a stress test of £85m. If a club fails to meet these requirements, the league can impose spending limits or demand a business plan.

    Infrastructure and revenue

    Newcastle faces a £1 billion requirement to fund a new city-centre stadium or a renovation of St James’ Park. The current ground holds 52,305 people. The club also identified a site in Woolsington near Newcastle Airport for a new training ground. Increasing matchday revenue through stadium expansion remains a priority for CEO David Hopkinson.

    Villa also focuses on infrastructure to drive revenue. The club expanded the North Stand at Villa Park this season. This expansion helps increase the matchday income needed to support their squad. Higher revenue allows for more flexibility under the SCR rules.

    Financial Metric Newcastle United Aston Villa
    Recent Revenue £335.3m £378m
    Recent Net Spend £105m £3m (5-year)
    Recent Major Sale £125m (Isak) £117m (Rogers)
    Squad Cost Ratio Limit £243m £265m

    A changing dugout

    The management situation at Newcastle changed abruptly this summer. Eddie Howe resigned following a 3-1 loss to West Ham. This departure occurred after the club sold Anthony Gordon to Barcelona for £69m and Sandro Tonali to Tottenham Hotspur for £92.5m. The club also faces uncertainty regarding captain Bruno Guimaraes, who expressed interest in joining Arsenal.

    Villa also saw significant changes in their leadership. The club saw the departure of Monchi, the president of football operations, who was a close confidant of Unai Emery. This happened as the club worked to maintain its squad following Champions League qualification. Villa also moved on from players like Leon Bailey to stay compliant.

    While Newcastle United players like Anthony Gordon and Sandro Tonali moved to Barcelona and Tottenham Hotspur respectively, Aston Villa saw Morgan Rogers depart for Chelsea for a record £117m to ensure they maintained their financial health under strict UEFA regulations this season.

    The youth gamble

    Newcastle’s current strategy relies on high-potential youngsters. They spent more than £100m on players aged 20 or younger this summer. This includes Ewen Jaouen, Sean Steur, Aladji Bamba, and Bazoumana Toure. The club expects these players to flourish with time. However, the club also faces the reality of a 12th-place finish.

    The club’s transfer approach shifted from buying established stars to developing talent. This move aims to navigate the constraints of the SCR. The club also needs to manage its UEFA settlement. They sold key players to ensure they had the ability to reinvest.

    Will the youth players deliver the promised returns?

    The club’s approach remains a point of debate. Some see it as a necessary evolution under new financial realities. Others worry it lacks the ambition promised in 2021. The club must balance this talent development with the need for immediate results.

    Villa’s tactical finance

    Villa’s finance model focuses on stability. They have invested over £500m in their squad since the owners bought the club in 2018. The club’s wage bill rose from £108m in 2019-20 to £273m in 2024-25. This growth includes bonuses for Champions League participation.

    The club continues to use its academy to stay competitive. They sold players like Jaden Philogene and Cameron Archer to stay within the rules. This method allows them to keep their core squad while meeting financial obligations. They also use loans to manage the squad. Villa signed Jadon Sancho and Harvey Elliott on loan to provide depth.

    They also made free transfers to bolster the team. They signed Victor Lindelof as a free agent. This allows them to focus their spending on more significant acquisitions. They also signed Evann Guessand from Nice.

    Villa excels instead.

    The club’s ability to remain competitive while selling talent shows a clear plan. They have achieved two Champions League qualifications and a Europa League title under Emery. They finished ahead of Tottenham Hotspur for the past four seasons. This success suggests their financial model works.

    Newcastle faces debt.

    The club’s net spend remains high. They spent £141m net in the summer of 2025. This follows a period where they spent £450m on players between the takeover and June 2024. The club’s reliance on selling stars like Alexander Isak and Anthony Gordon shows the pressure of the rules. They must continue to sell to keep spending.

  • Knicks frontcourt rotation faces pressure after key departures

    Knicks frontcourt rotation faces pressure after key departures

    Mitchell Robinson joined the Boston Celtics in free agency. This departure left the New York Knicks without their best interior defender. Robinson averaged 22.2 rebounds per 100 possessions during the 2025-26 regular season. He also recorded 10.6 offensive rebounds per 100 possessions. No other player in NBA history averaged more than 10 offensive boards per 100 possessions over a full season. Robinson shot 72.3 percent from the field last season. He finished his career with a 70.2 percent field goal percentage. He also averaged 2.1 blocks per 36 minutes. The frontcourt is thin.

    Isaiah Hartenstein moved to the Oklahoma City Thunder. He signed a three-year, 87 million dollar contract. This departure prompted the Knicks to trade Julius Randle, Donte DiVincenzo, and a first-round pick to the Minnesota Timberwolves for Karl-Anthony Towns. Hartenstein currently averages 12.6 points, 12.2 rebounds, and 3.9 assists for the Thunder. He also recorded 17 victories in 18 games since joining the Thunder. Hartenstein believes the move benefits both parties. He says Leon Rose makes the right adjustments. Hartenstein previously played for the Knicks, where he averaged 8.3 rebounds and 2.5 assists. He recovered from a broken hand in the preseason before joining the Thunder rotation.

    Knicks frontcourt rotation faces pressure after key departures (2)

    Karl-Anthony Towns faces bilateral knee soreness. This condition downgraded him from questionable to doubtful against the Indiana Pacers. Towns averages 20.0 points, 11.9 rebounds, and 2.9 assists over 63 games. He shoots 49.3 percent from the field and 37.3 percent from three. Towns faces soreness. Josh Hart also manages soreness in his left knee. Hart averages 11.8 points, 7.8 rebounds, and 5.1 assists over 54 games. He shoots 49.5 percent from the field and 37.7 percent from three. Hart also manages aches in his ankles and back. If Hart misses more games, Jordan Clarkson likely absorbs those minutes. Clarkson scored 27 points on 10-of-15 shooting during his last appearance against Utah. Hart played for Villanova and earned a four-year, 80.9 million dollar contract extension. Towns earned six All-Star selections and the 2015 Rookie of the Year award.

    James Dolan requires the Knicks to stay below the second apron. This limit sits at approximately 220 million dollars. The Knicks owe 192 million dollars to their starting five alone. They also owe money to players like Deuce McBride, Tyler Kolek, Pacome Dadiet, Mohamed Diawara, and Jose Alvarado. Leon Rose must navigate the roster construction carefully because owner James Dolan refuses to exceed the second apron, which sits at approximately 220 million dollars, even though the team wants to repeat their title success. The team could use the contracts of Miles McBride and Pacome Dadiet to facilitate a trade. These two contracts combine for 6.94 million dollars. The situation remains uncertain.

    The Knicks look for a backup center. They recently missed out on Moussa Diabate after the Dallas Mavericks matched their offer sheet. Diabate averages 7.9 points and 8.7 rebounds. The team also looks at Nick Richards, a client of CAA. Richards averaged 5.8 points and 5.1 rebounds for the Suns and Bulls. Other targets include Yves Missi and Mouhamadou Gueye. The Knicks previously tried to trade for Missi in a package with Jose Alvarado. Thomas Sorber could provide upside. He sits behind Andre Drummond for Oklahoma City. He has yet to make an NBA debut due to injuries. Luka Garza could serve as a reliable backup. He shoots three-pointers. The Celtics might trade him because they added Mitchell Robinson and Neemias Queta. They also drafted Chris Cenac Jr. in the first round of the 2026 draft. Can the team survive without a reliable second big man?

    The team needs to increase Miles McBride’s minutes alongside Jalen Brunson and Towns. McBride’s presence helps create space. The pairing of McBride and Towns produced a +9.6 net rating last season. McBride’s defense helps Jalen Brunson. Jose Alvarado also benefits from playing with Towns. The Alvarado and Towns pairing produced a +18.2 net rating. Alvarado works to get the ball to Towns early. You already know the Knicks’ championship run relied on frontcourt grit.

    Player PPG RPG APG
    Karl-Anthony Towns 20.0 11.9 2.9
    Josh Hart 11.8 7.8 5.1
    Moussa Diabate 7.9 8.7 1.9
    Luka Garza 8.1 4.1 1.0
    Nick Richards 5.8 5.1 0.7
    Isaiah Hartenstein 12.6 12.2 3.9

    The Knicks rely on Andre Drummond and Ariel Hukporti for center depth. Drummond joined on a minimum contract. Hukporti is a second-year project. Trey Jemison III also received minutes during the season. The roster lacks depth. Mitchell Robinson struggled with injuries throughout his career. He played only 60 games in the 2025-26 season. He played 48 games in the prior two seasons combined. He converted just 17 of 58 free throw attempts during the postseason. This 29 percent accuracy from the line hindered the offense.

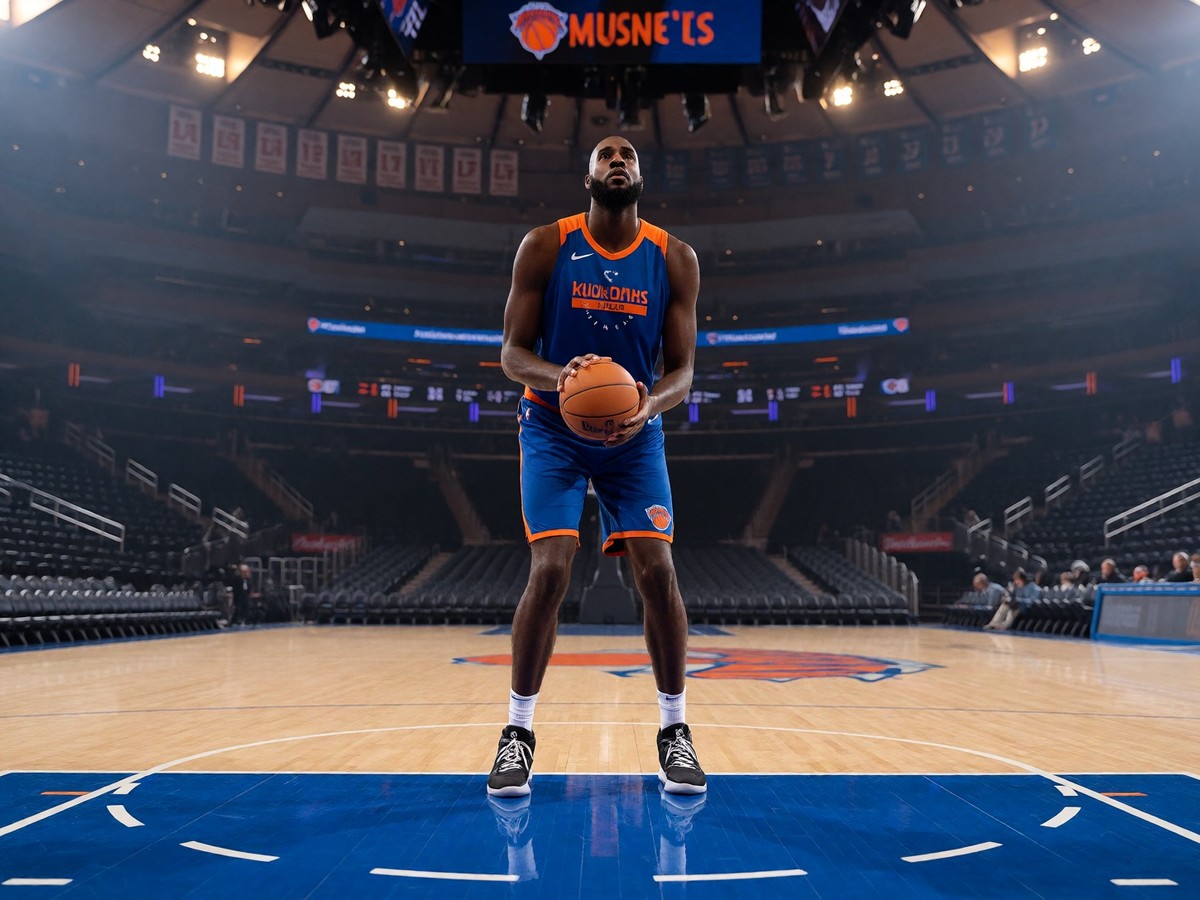
    The Knicks seek to defend their championship. Losing Mitchell Robinson left a hole in the rotation. The team also faces injury concerns with Towns and Hart. The frontcourt rotation remains a struggle for Mike Brown.

    Player FG% 3PT%
    Karl-Anthony Towns 49.3% 37.3%
    Josh Hart 49.5% 37.7%
    Moussa Diabate N/A N/A
    Luka Garza N/A N/A
    Nick Richards 51.2% N/A
    Isaiah Hartenstein 62.2% 0.0%