Category: Uncategorized

  • How to start Solana restaking on Jito as EigenLayer rivalry heats up

    How to start Solana restaking on Jito as EigenLayer rivalry heats up

    EigenLayer holds $19.7 billion in total value locked in 2026. Jito’s block-building stack runs on 60% of Solana’s stake weight. EigenLayer uses Actively Validated Services (AVSs) to secure middleware. Jito uses Node Consensus Networks (NCNs). NCNs like TipRouter and Switchboard use restaked assets for economic security. Lucas Bruder says Solana’s low fees allow for more composable and fast work. Sreeram Kannan says EigenLayer is a platform for building decentralized services. EigenLayer’s AVSs allow developers to rent Ethereum’s security. Jito’s NCNs allow projects to borrow security from existing SOL validators.

    The mechanics of Jito restaking

    Restakers delegate tokens to NCNs through the Vault program. The program issues VRTs to represent the user’s stake. These VRTs can be traded or used in DeFi. Node operators run the offchain protocols for NCNs. They receive stake from approved vaults.

    How to start Solana restaking on Jito as EigenLayer rivalry heats up (2)

    NCNs pay rewards to restakers and node operators. NCNs enforce specific slashing conditions. Each NCN defines an offchain protocol. Node operators opt in to service these operations. NCNs allow projects to launch without building a consensus or a network of validators from scratch.

    The Jito TipRouter is a live NCN that optimizes the routing of transaction tips. It collects 3% of all tip revenue as a fee. 2.7% of the revenue flows to the Jito DAO. 0.15% flows to SOL vault operators. 0.15% flows to JTO vault operators. This model ensures that restakers and validators receive incentives.

    How to use the Jito interface

    I prefer the asset-first method.

    The Jito interface provides a toggle for deposit methods. You can select your asset first or choose a vault first. To start, go to the Jito restaking website. Connect a Solana wallet such as Phantom or Solflare. Choose your preferred approach via the toggle. Pick a token and a compatible vault. Enter the amount. Review and confirm the transaction. You should check the specific fee structure before depositing.

    If you select the vault first, you pick a vault and then deposit compatible assets. If you select the asset first, you pick your token and then select a compatible vault. After you deposit, your assets sit in a vault smart contract. You receive VRT tokens representing your share.

    If you want to exit your position quickly, you can swap your liquid staking tokens for SOL on a decentralized exchange like Jupiter, though you must accept a slippage of approximately 0.3% for the transaction. A standard withdrawal involves a two-epoch cooldown that lasts 4 to 5 days. Using Jito for withdrawal involves a 0.1% fee and a 1-day delay.

    Yields and liquid staking assets

    jitoSOL provides MEV rewards. In mid-2026, jitoSOL implied APY sits near 5.6% to 5.7%. Native Solana staking rewards are 6-7% APY. jitoSOL holders earn an extra 0.5-1% from MEV tips. Marinade’s mSOL has over $1.2 billion in TVL. Renzo supports $36 million on Solana. Solayer has $112 million in total deposits and 304,000 users.

    Protocol Type 2026 Yield (Approx)
    Native Solana Staking 6-7%
    jitoSOL Liquid Staking 7.2-7.8%
    EigenLayer Restaking 5-15%
    Solayer Restaking 7.65%
    Renzo LRT 7.2%

    jitoSOL is a reward-bearing token. Its value relative to SOL climbs as rewards accrue. This happens because Jito captures MEV tips from arbitrage bots and distributes 95% to holders. In 2026, the premium from MEV tips narrowed because transaction-ordering tips fell.

    I use Phantom.

    Managing risks and validator performance

    Slashing is a risk.

    Slashing is a penalty where a portion of staked assets is lost if an operator fails to follow NCN rules. NCNs enforce these conditions. Slashing can be multi-tiered. If an operator is dishonest, the stake is lost. NCNs can also define maximum slashable amounts per epoch per operator.

    The top three validators hold 26% of delegated SOL. This includes Helius, Binance Staking, and Galaxy. The Nakamoto coefficient is 20. This means 20 validators could halt block production.

    Smart contract risk exists in all DeFi protocols. If a vault contract has a vulnerability, assets could be lost. Liquidity risk is also possible. VRT prices may diverge from the underlying asset during high demand.

    Regulatory risks exist for exchange-based staking. The SEC brought enforcement actions against Coinbase and Kraken in 2023.

    Comparing Solana and Ethereum strategies

    Jito handles 60%.

    Jito focuses on services like keepers, oracles, and MEV networks within the Solana Layer 1. EigenLayer focuses on scaling Ethereum through AVSs. EigenLayer requires EigenDA for data availability because Ethereum has limited throughput. Solana’s high throughput and low fees make restaking more accessible to everyday users.

    Jito’s liquidity is tied to VRTs. EigenLayer uses Liquid Restaking Tokens (LRTs). Both allow users to maintain liquidity in DeFi.

    What happens if NCN adoption fails?

    I find Jito to be the better choice for Solana users.

  • Player prop markets lead NFL betting growth

    Player prop markets lead NFL betting growth

    The NFL legal handle in 2025 reached approximately $35 billion across US regulated mobile sportsbooks. Seven national operators control more than 92 percent of the mobile NFL handle. These companies include DraftKings, FanDuel, BetMGM, Caesars, Fanatics, BetRivers, and ESPN BET. Player props represent the biggest growth segment in the current wagering market. DraftKings lists more than 400 distinct player-prop markets for a typical Sunday afternoon game.

    The handle grew.

    Bettors use the difference between the percentage of bets and the percentage of money to identify sharp action. A difference exceeding 15 percent between these two figures often signals professional interest. In the 2025-26 season, the public went 1-3 in Week 1 games where more than 75 percent of the money sat on one side. The public finished that season with a 145-140 record against the spread. Public betting volume often favors big brands like the Lions, Bills, Eagles, Chiefs, and Cowboys. However, the most profitable teams for bettors in 2025-26 were the Patriots and Seahawks.

    The money moves.

    Specific player props provide clear paths to value for those who study usage and matchup data. Bijan Robinson handles approximately 65 percent of team rushes in Atlanta and ranked fifth in receiving yards last season. His rushing yards line sits at 68.5. James Cook owns roughly two-thirds of the Bills’ rushing volume and scored 16 rushing touchdowns last season. His rushing yards line sits at 71.5.

    Player Prop Type Line Odds
    Bijan Robinson Rushing Yards 68.5 -110
    James Cook Rushing Yards 71.5 -114
    Matthew Stafford Passing Yards 240.5 -114
    Dak Prescott Passing TDs 1.5 -144
    George Pickens Receptions 4.5 -172
    Alvin Kamara Receptions 5.5 -115
    Jaxson Dart Passing TDs 0.5 -212
    James Conner Rushing Yards 68.5 -110
    Brenton Strange Anytime TD N/A +400
    Njoku Receiving Yards 50+ -114

    The volume rises.

    Tight end production offers another way to find edges in the opening week. Brenton Strange faces a Panthers defense that surrendered 11 receiving touchdowns to tight ends in 2024. Head coach Liam Coen previously favored tight ends like Cade Otton in the red zone. Njoku faces a Bengals defense that allowed the third-most receiving yards to tight ends in 2024. Joe Flacco averaged 78 receiving yards per game in five starts for the Browns during the 2023 regular season. Njoku exceeded his yardage totals in five of 11 games last season.

    The data supports various outcomes for the opening slate. Bijan Robinson faces a Buccaneers defense that surrendered the fifth-most receiving yards to backs last season. He averaged 25.4 receiving yards per game last year. James Cook faces a Carolina defense that allowed 130 rushing yards per game to running backs. He topped 60 yards in five of his last six appearances. Matthew Stafford faces a Texans defense that allowed 6.2 yards per pass attempt last season. He averaged 235.1 passing yards per game last season. Dak Prescott faces a Denver defense that allowed passing completions in the intermediate zone. He averaged 3.3 passing touchdowns in his last three weeks. George Pickens faces a Dallas defense that allows completions to receivers. He averaged 4.2 receptions per game last season. Alvin Kamara averages nearly seven targets per game. He faces a Tampa Bay defense that leads the league in receptions allowed to running backs. Jaxson Dart faces a Philadelphia defense that allows completions near the goal line. He averaged 2.0 passing touchdowns in his last three starts. James Conner faces a New Orleans defense that allowed the sixth-most rushing yards to backs in 2024. He exceeded his rushing line in eight of 16 games last season.

    You already know how to watch for shifts in the spread before kickoff.

    The 2025-26 season saw favorites win 65.9 percent of their games outright, but these same teams only covered the spread 47.8 percent of the time during that entire campaign. The numbers 3 and 7 account for 15 percent and 9 percent of all NFL final-margin frequencies. Will the public continue to favor heavy favorites during the opening week? I recommend taking the over on Bijan Robinson’s rushing yards.

  • Sectoral movement and economic trends in India’s 2026 fiscal year

    Sectoral movement and economic trends in India’s 2026 fiscal year

    Real GDP for the March 2026 quarter grew 7.8% compared to the previous year. This growth exceeds the 7.2% expectation from market analysts. Manufacturing output grew 7.3%, while financial and real estate services grew 10.4%. Trade, hotels, transportation, and communication grew 12.5%. Construction grew 8.4%. Mining and quarrying grew 5.4%. Agriculture and feedstock grew 3.6%. For the full 2026 financial year, GDP expanded by 7.7%. This follows the 7.1% growth recorded in 2024. The 2020 contraction of 5.8% remains the largest setback in recent history. Historically, India’s share of world income fell from 22.6% in 1700 to 3.8% in 1952. The Mughal economy in the 17th century produced about 25% of global industrial output.

    Sector GVA in 2024-25 (INR Crore) Share (%)
    Agriculture 2,476,805 14.41%
    Industry 5,270,112 30.66%
    Services 9,440,530 54.93%
    Manufacturing 4,169,419 13.89%
    Construction 2,627,209 8.75%

    The UPI transaction scale

    The Unified Payments Interface (UPI) provides a low-cost digital transaction layer that reaches businesses far outside the formal corporate economy, helping to facilitate greater financial inclusion for millions of small merchants across the country. In the 2025-26 financial year, UPI processed 24,161.69 crore transactions. This transaction value exceeded ₹314 lakh crore. The network expanded from 21 banks at launch to 703 banks by March 2026. In August 2025, UPI recorded 1,270.5 crore person-to-merchant transactions worth ₹7.24 lakh crore. The IMF reported in June 2025 that UPI is the largest retail fast payment system globally, accounting for 49% of global real-time digital transactional systems. In FY2017-18, UPI processed 91.5 crore transactions. By FY2024-25, the volume reached 18,587 crore transactions. This reflects a CAGR of 114%. The JAM Trinity provided the foundation for this expansion. Jan Dhan accounts exceeded 558.3 million by July 2025. Aadhaar issuance reached 142 crore cards by June 2025. Mobile connectivity reaches 116 crore subscribers.

    Micro-enterprise and vendor credit integration

    Micro-enterprises lead the MSME sector. MSMEs contribute 30.10% of India’s GDP at current prices. They generate 36% of all manufacturing output. These businesses employ over 24 crore people. Micro-enterprises account for 98.60% of registered units. MSME exports rose from Rs. 3.95 lakh crore in FY21 to Rs. 12.39 lakh crore in FY25. Export counts grew from 52,849 to 1,73,350 in the same period. The PM Street Vendor’s AtmaNirbhar Nidhi scheme supports urban street vendors through digital incentives. By July 2026, 76.95 lakh street vendors took 1.15 crore loans worth ₹18,475.06 crore. More than 55 lakh beneficiaries used digital onboarding. These vendors completed 841 crore digital transactions worth ₹8.96 lakh crore. A 2025 impact assessment by the Indian School of Business found that average annualised business income among SVANidhi borrowers increased by 20% between 2023 and 2025. The Automatic Milk Collection platform covers 17.3 lakh milk producers. The KANCHI platform profiles 45,000 small farmers in Odisha, Tamil Nadu, and Uttar Pradesh. You should note the shift in credit access.

    Trade and monetary policy trends

    The US-India trade deal, announced in February, reduced tariffs on Indian goods from 25% to 18%. This reduction provides a 0.2 percentage point boost to annual GDP. This brings India’s tariff rate in line with other Asian countries, which typically range from 15% to 19%. In June, the RBI kept policy rates unchanged to support credit growth. Credit growth reached 17.7% in June, the highest level since May 2024. Overseas investors invested US$4.2 billion in Indian government bonds in June. This inflow marks the strongest since August 2024. Tensions in the Middle East keep input costs high. The European Central Bank announced a rate hike at its June meeting. Growth remains steady. Tariffs dropped to 18%. Vendors use digital tools. Will the rural consumption surge persist?

  • Fed vs ECB: Which central bank wins the rate-cut race in 2026

    Fed vs ECB: Which central bank wins the rate-cut race in 2026

    Monetary policy divergence

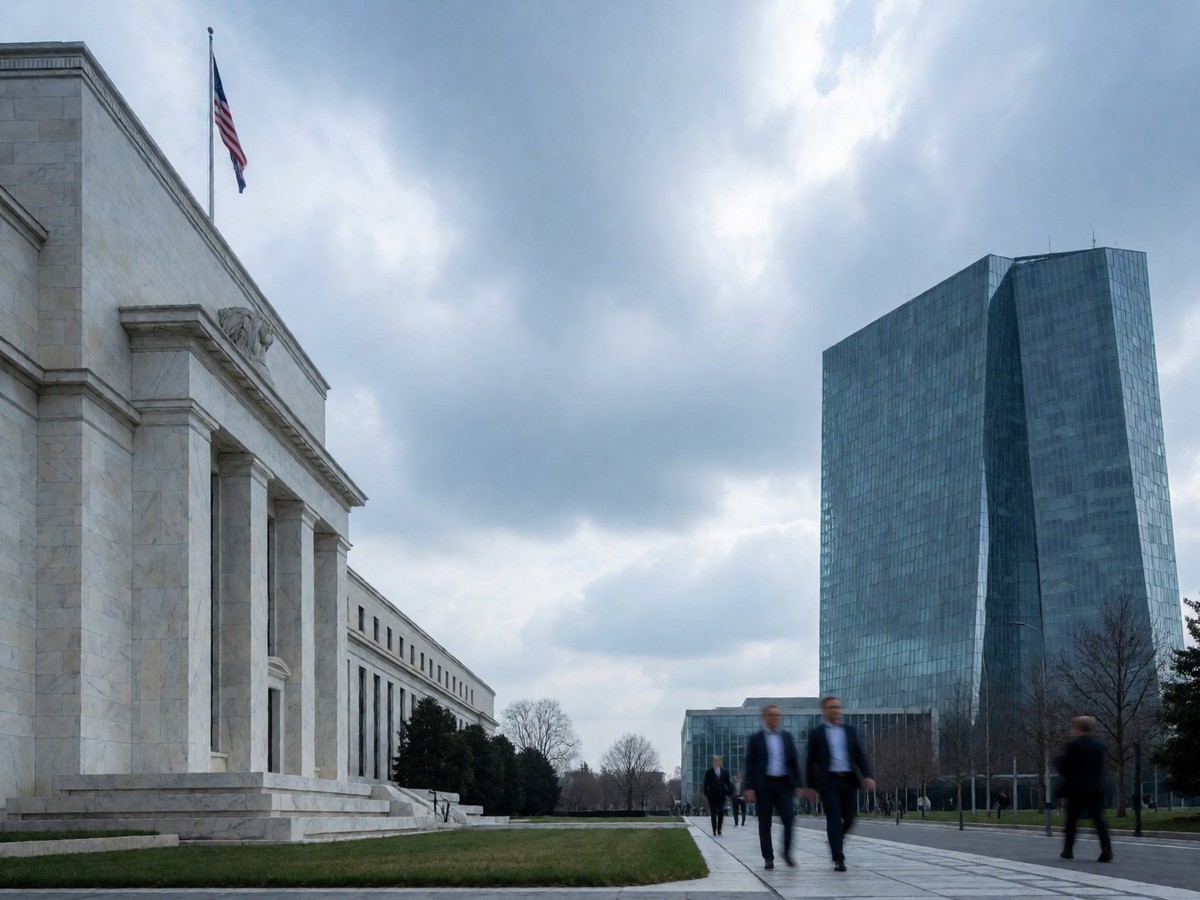
    The Federal Reserve maintains the target federal funds rate at 3.50% to 3.75%. This decision follows the March 18, 2026, meeting where officials held rates steady. This position followed a series of rate cuts in late 2025, including a 25 basis point reduction on October 12 and another on November 12. The European Central Bank moved in a different direction. On June 17, 2026, the ECB raised its three key interest rates by 25 basis points. This hike increased the deposit facility rate to 2.25%, the main refinancing operations to 2.40%, and the marginal lending facility to 2.65%. The ECB previously began a cycle of rate hikes in July 2022.

    Central Bank Interest Rate Type Level (August 2026)
    Federal Reserve Fed Funds Target 3.50% – 3.75%
    ECB Deposit Facility 2.25%
    ECB Main Refinancing 2.40%
    ECB Marginal Lending 2.65%

    The Fed target stays higher.

    Energy price volatility

    Energy costs drive current monetary policy uncertainty. The escalation of the Middle East conflict pushed oil and gas prices higher in July. Because the renewed escalation of the conflict in the Middle East pushed oil and gas prices higher in July, headline inflation across the euro area rose to 2.9% while core inflation climbed to 2.5%. Christine Lagarde noted that the intensity and duration of this energy shock influence the likelihood of broader inflation through second-round effects.

    The US economy faces different inflationary pressures. US headline inflation remains above target as May CPI reached 4.2% year over year. The Fed updated its 2026 PCE inflation forecast to a median of 3.6%. This is a significant increase from the 2.7% forecast provided in March. Core PCE inflation for 2026 also rose to 3.3% from the 2.7% projection.

    Inflation stays high.

    The Fed resists easing.

    Economic growth and dot plots

    Economic growth profiles differ between the two regions. The Fed projects US real GDP growth of 2.2% in 2026, which is a decrease from the 2.4% estimate in March. US labor markets remain resilient with 172,000 payrolls added in May, exceeding the 80,000 consensus. The unemployment rate sits at 4.3%. Annual wage growth slowed to 3.4%.

    The ECB projects much weaker growth in the eurozone. Staff forecasts suggest 0.8% growth in 2026 and 1.2% in 2027. This is a downward revision from the 1.2% and 1.5% estimates in March. Defense spending provides some support, but it will not counteract growth deceleration.

    The Fed dot plot indicates a hawkish outlook. Nine of the 18 participants projected the year-end 2026 target range at or below the 3.50% to 3.75% level. However, the median range sits between 3.75% and 4.00%. Three participants expect a 25 basis point hike, and five expect a 50 basis point hike. Only one official projects a 25 basis point cut.

    You know the basics of central bank policy. Monetary policy transmission takes nine to 18 months to reach the real economy.

    The winner

    The ECB wins the rate-cut race.

    The Federal Reserve will likely maintain high interest rates throughout 2026. The committee sees inflation stickiness as a major hurdle. The median projection for 2027 rates sits between 3.1% and 3.9%. Kevin Warsh, the former Morgan Stanley dealmaker who became Fed Chair in May 2026, argues that the committee must deliver price stability.

    The ECB faces a different reality. The ECB staff expects headline inflation to hit 1.7% in 2026. This undershoots the 2% target. Core inflation in 2026 should average 1.9%.

    ECB faces pressure.

    The Fed’s inflation projections remain significantly higher than previous estimates. Will the Fed abandon its hawkish tone if AI productivity increases further?

  • The future of Andrea Kimi Antonelli at Mercedes after Wolff’s

    The future of Andrea Kimi Antonelli at Mercedes after Wolff’s

    The championship fight

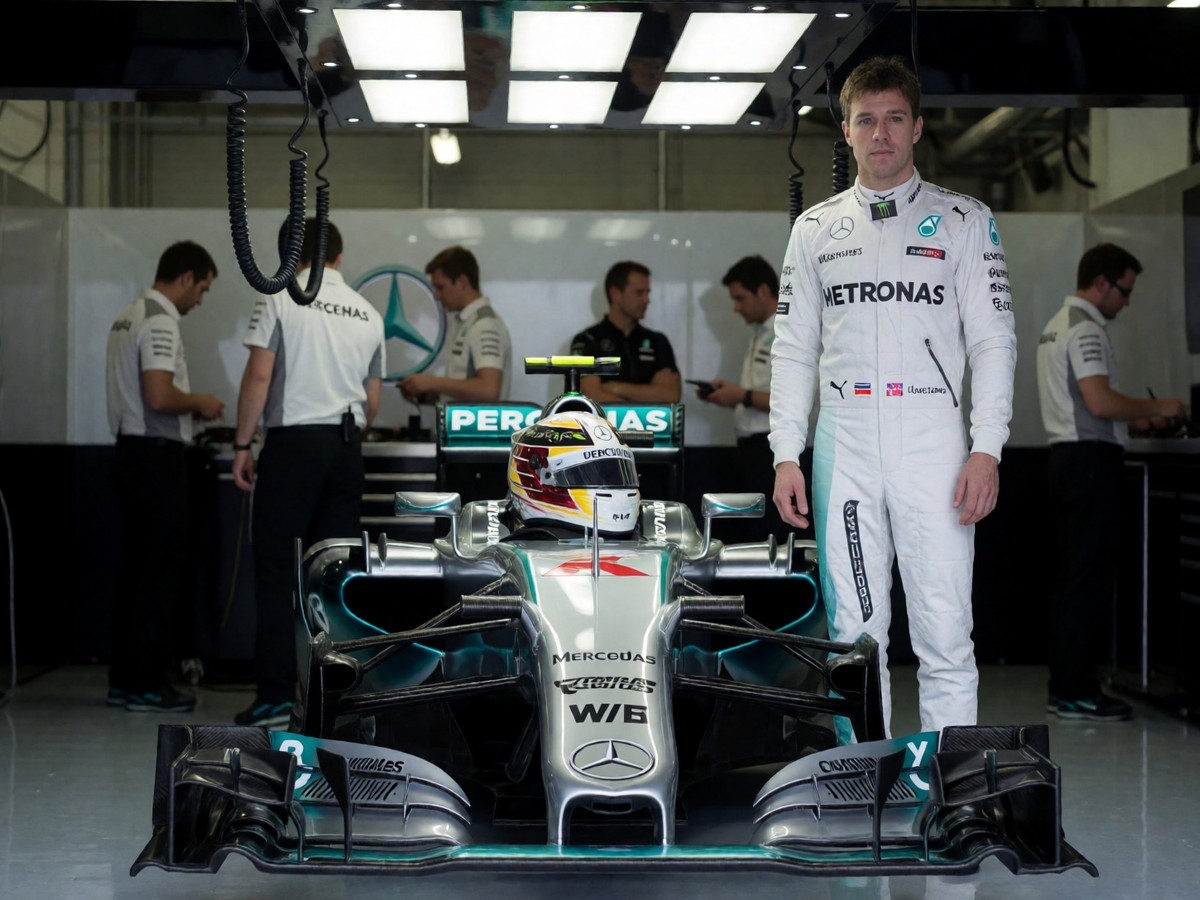
    Kimi Antonelli leads the 2026 Drivers’ Championship with 242 points. He holds a 59-point advantage over George Russell and Lewis Hamilton, who both have 183 points. Mercedes won eight of the first 11 races this season. Antonelli won six of those races. He became the youngest championship leader at Round 3 in Japan. He is also the first teenager to win multiple Grands Prix. Antonelli has 219 points in total. Russell has 160 points.

    The gap remains massive.

    Antonelli won the Chinese Grand Prix in March 2026. He also won in Japan. He was the first Italian to win back-to-back races since 1953. He holds the record for the youngest pole position. Russell faces a difficult fight for the title. He sits in third place after some challenging weekends. He won the Australian Grand Prix, but Antonelli took two consecutive wins. Russell struggled with an engine failure in Montreal and issues at Silverstone and Spa. He also faced an anti-stall problem in Budapest. Last year, Antonelli finished the season 150 points behind Russell. The conversation surrounding the championship also included the 50G crash of Oliver Bearman.

    The financial disparity

    Antonelli’s 2026 base salary is $2,000,000. This figure is the same as his 2025 rookie deal. His performance bonuses can reach $12,000,000. Mercedes uses this structure to align his earnings with race results. His total potential earnings for the year are $13,500,000. His sponsorship income comes from brands like Adidas and Monster Energy. His net worth is roughly $5,000,000. This amount comes from his Mercedes salary and performance bonuses.

    Category Antonelli (2026) Russell (2026)
    Base Salary $2,000,000 $34,000,000
    Performance Bonuses up to $12,000,000 Not disclosed
    Total Potential $13,500,000 Not disclosed

    The disparity is enormous. Mercedes secured Antonelli through 2029, a three-year extension that signals a multi-decade investment in the nineteen-year-old as the successor to the team’s driver lineage after the departure of Lewis Hamilton. He will not test the market because Mercedes holds significant leverage. You know how much a championship win changes a driver’s earnings. Antonelli’s base salary translates to $166,667 per month and $38,462 per week. On a daily basis, he earns $5,479. If he reaches his full bonus potential, his monthly income reaches $1,125,000. This would mean he earns $259,615 per week. Max Verstappen earns $70,000,000 annually. Lewis Hamilton earns $40,000,000. Charles Leclerc earns up to $35,000,000.

    Management and the Verstappen rumors

    Toto Wolff describes the Russell and Antonelli relationship as a "healthy rivalry". He says both drivers focus on the Constructors’ Championship. Mercedes wants to win both titles. Wolff says the team has a "perfect line-up" and believes in its future. He also spoke about Max Verstappen. Wolff said he is not afraid of having Verstappen in the team one day. However, he said adding a new variable right now is not right for long-term development. Mercedes decided to make its 2026 driver selection during the summer break.

    Red Bull disagrees. Christian Horner said the Mercedes comments are "just noise". Verstappen has a contract with Red Bull until 2028. He might have performance clauses for an earlier exit. Wolff said it is unlikely that Verstappen joins Mercedes in 2026. Mercedes focuses on stability. The team achieved a 72-point lead over Ferrari. They won 8 of 11 races. Wolff says the team is happy with the current dynamics. He wants to avoid unnecessary disruption to their upward trajectory.

    Will Verstappen ever move?

    Technical differences in driving style

    Antonelli and Russell have different driving styles. Antonelli is aggressive. He uses precise and subtle inputs to manage the car. This helps him handle microslides in low-downforce cars. He can energise front tyres when they need it. He manages peak loads well. He was second in all three sectors during his Monaco pole lap. His style involves carrying speed through the ability to make constant tiny corrections.

    Russell prefers a smooth, high-commitment style. He aims for stability during turn-in. He often trades mid-corner speed for higher exit speed. This style puts high peak loads through the tyres. He has struggled to keep the Pirellis in the correct window. This causes the rear to slide and overheating to occur. He also struggled in Miami and Monaco. He uses a "don’t brake later, brake less" approach to stabilize the car.

    The tyres are the issue. Antonelli has 7 qualifying wins compared to Russell’s 4. Antonelli has 5 race wins compared to Russell’s 4. Antonelli has 361 laps ahead of Russell.

  • Chelsea’s summer overhaul remains a massive gamble

    Chelsea’s summer overhaul remains a massive gamble

    Chelsea has spent more than $350 million this summer. The $156 million fee for former Aston Villa star Morgan Rogers makes him the most expensive Chelsea signing in history and the second-most expensive player in Premier League history after the club beat Inter Milan and Arsenal to the deal. This purchase follows a pattern of targeting young talent with high resale potential. The club values 18-year-old Kerim Alajbegovic at $41 million. These signings, including Marco Palestra, Maxence Lacroix, and Geovany Quenda, follow the club’s 10th place finish last season. The ownership has spent $2.3 billion since 2022. Chelsea also targeted Pep Chavarria and Alex Scott, though the latter was rejected by Bournemouth. The club must still manage a 25-man squad limit and 17 non-homegrown player rule. This recruitment strategy relies on amortization, where the club spreads transfer fees over the length of a contract. However, UEFA now limits this spreading to a five-year period. The club has previously used long contracts to manage costs, such as the eight-and-a-half-year deal for Mykhailo Mudryk.

    The squad remains large.

    Defensive instability and tactical shifts

    The defense conceded 12 goals during the pre-season tour. Xabi Alonso took over after Enzo Maresca left on New Year’s Day. Maresca’s squad finished 10th in the Premier League. The team made 41 errors leading to a shot. They also made 18 errors leading to a goal. These figures rank third in the Premier League. Alonso faces pressure. He must manage a defense that lacked stability. Maresca made 25 changes to his back four in 19 Premier League matches. The manager started seven unique back fours during the 2025/26 season. The squad conceded 63 goals last season. This was the ninth-most in the division. The defense struggled with transitions and communication. In the 2024/25 season, the team also ranked 12th highest for PPDA. Alonso needs to implement his preferred back-three system with attacking wingbacks. This requires players like Palestra and Quenda to provide width.

    A crowded roster and forced departures

    The squad includes 44 players. You know the roster size is excessive. The club wants to trim this group to avoid wage bill issues. They placed a $120 million valuation on Enzo Fernandez. They also set a £75 million price tag on Malo Gusto. The club sold Conor Gallagher to Atletico Madrid for £38 million. Marc Cucurella moved to Real Madrid. Andrey Santos joined Manchester United. A nine-month ban on recruiting domestic academy players affects the club. The squad remains bloated. The club also holds a £65 million valuation on Nicolas Jackson. Other players for sale include Axel Disasi at £25 million and Benoit Badiashile at £30 million. Trevoh Chalobah faces interest from Como after a $35 million offer arrived. Marc Guiu and David Fofana are also available for loan. Players like Aaron Anselmino and Datro Fofana have also returned from loan.

    The struggle against low blocks

    Chelsea struggled against low blocks last season. Every attacker had an aerial duel win rate below 50%. This lack of physical presence made it hard to score when defenses sat deep. The club signed Liam Delap to provide a more traditional presence in the box. They also brought in Jamie Gittens to improve dribbling on the wings. These moves aim to fix the issues that hampered the team last year. Chelsea averaged 1.14 non-penalty expected goals per match during certain stretches. They need players who can score from crosses. The squad includes Mykhailo Mudryk, who returns after a suspension for a positive test for meldonium. Raheem Sterling faces a battle to reclaim his place. Christopher Nkunku remains a key option, though he often plays a different role than Nicolas Jackson. The club must manage these many attacking talents. Can Alonso find the stability the club needs?

  • The logistical and physiological disaster of a 64-team World Cup

    The logistical and physiological disaster of a 64-team World Cup

    FIFA plans to expand the men’s World Cup to 64 teams, a move that increases the total match count to 128. The 2026 tournament uses 104 matches. This growth requires a six-week tournament. The 2030 World Cup involves six host nations across three continents. It begins with opening matches in Uruguay, Argentina, and Paraguay. Spain, Portugal, and Morocco host the majority of the remaining games. While the 48-team tournament in 2026 uses 15 stadia for 104 games, a 64-team tournament would necessitate 20 grounds to handle 128 matches across its extended duration. This expansion creates a massive burden for host nations. Approximately 1.25 million people must travel across these six countries.

    The decision stays unsettled.

    Financial influence and political tension

    FIFA President Gianni Infantino pushes for expansion to grow revenue. More games allow FIFA to sell more tickets and merchandise. This revenue funds multimillion-dollar handouts to each of the 211 member associations. The 2022 tournament delivered 7.5 billion dollars in revenue. Expansion to 64 teams increases the number of matches and the money FIFA collects. UEFA President Aleksander Ceferin and AFC President Sheikh Salman bin Ibrahim Al Khalifa oppose this expansion. They argue that easier qualification reduces the commercial value of regional qualifying competitions. If broadcasters place less value on qualifying campaigns, regional confederations become more dependent on FIFA distributions. This shifts financial influence toward the global governing body.

    Money drives this.

    Player wellness and the heat factor

    The physical toll on players is real. You already know how much a long season exhausts a squad. Players like Julian Alvarez have played 274 times since February 2022. Chelsea played 113 games in the 2024-25 season. Real Madrid played 114 games. 86% of players want at least 14 days of preparation time. 61% want 14 to 28 days of post-tournament recovery. The gap between the Champions League final on May 30 and the World Cup opening on June 11 is only 12 days. Players face extreme workloads.

    The quality drops.

    Extreme heat in Miami and Houston adds to the strain. In humid conditions, the body struggles to release heat. During vigorous exercise, the body generates heat 15 to 20 times faster than at rest. Core temperatures can rise 1.8 degrees Fahrenheit every five minutes. A core temperature above 104.9 degrees Fahrenheit is a medical emergency. Heat stroke can lead to confusion, disorientation, or a loss of consciousness. In extreme cases, mortality from exertional heat stroke exceeds 80%.

    Will FIFA prioritize revenue over the very players who create the product?

    Competitive balance and tournament integrity

    The 2026 World Cup showed how expansion affects competition. The tournament had 308 goals, compared to 172 in the 2022 edition. The average was 2.96 goals per game. However, the talent gap remains wide. Cabo Verde, Curacao, Uzbekistan, and Jordan were all first-time qualifiers in 2026. None of them won a single match. The tournament becomes predictable. The 64-team format removes the third-place qualification route. Teams would only advance if they finish in the top two of their group.

    The math remains simple.

    The expansion to 64 teams is a logistical and physiological disaster. More matches mean more pressure on domestic leagues that follow a traditional August-to-May season. The 2031 Women’s World Cup will likely move to 48 teams in the United States. FIFA continues to push for more games despite the backlash. The 2030 centenary will host 16 more teams than the 2026 edition. This creates 96 group stage matches instead of 72. Expanding the field makes the tournament more expensive for national federations. The French Football Federation expected to spend 28 million dollars on the 2026 tournament. A 64-team event increases these costs.

  • Ethereum staking yields and Lido dominance after Pectra upgrade

    Ethereum staking yields and Lido dominance after Pectra upgrade

    Pectra changed Ethereum staking on May 7, 2025. This upgrade bundled 11 EIPs to change how validators operate and how rewards distribute.

    Staking efficiency and new rules

    EIP-7251 raised the maximum effective balance from 32 ETH to 2,048 ETH. Large stakers can now aggregate many validators into one process. This reduces consensus overhead because fewer signatures need propagation. It also allows for reward compounding, though you must manually skim rewards to trigger the gas cost. EIP-6110 moved validator deposits to the execution layer. This change cut activation times from hours to about 13 minutes. EIP-7002 introduced execution-layer-triggered exits. You can now initiate a withdrawal via a smart contract call using withdrawal credentials. This removes the need to rely on a validator operator to sign an exit message.

    Staking Venue Annual Net Yield
    Solo Validators 3.2% to 3.8%
    Liquid Staking (Lido/Rocket Pool) 3.0% to 3.5%
    Centralized Exchanges 2.5% to 3.0%
    Restaking (EigenLayer) +1% to 3% extra

    Yields sit lower than in previous years. In 2023, solo validators earned 5.5%. Currently, about 32% of all ETH is staked. This high participation rate spreads fixed protocol issuance across more participants. MEV income also affects these numbers. MEV provides roughly 30% of validator income. A slowdown in DeFi during 2024 and 2025 reduced this revenue.

    Lido holds 23% of the staked ETH market share. This figure fell because large players like BitMine and Grayscale entered the market. Lido provides liquid staking through stETH and rETH. These protocols face smart-contract risk.

    Yield drivers and Lido dynamics

    The market faces ongoing pressure from ETH price movements. In late December, ETH traded above $3,000, but it dropped to $2,020 by February 25, 2026. Lido reported that if ETH stays at $2,000, projected net revenue from staking fees drops from $45.3M to $33.4M. The protocol responded by enforcing cost discipline. Lido’s 2025 spending was 10% lower than in 2024.

    Lido continues to expand its product line. The Lido V3 launch allowed for tailored staking products. The WisdomTree ETP launched in December with over $36M AUM. Lido also manages the Permissionless Community Staking Module, which is the largest module by ETH staked. For holders with smaller positions, liquid staking via Lido or Rocket Pool provides access to yields without the 32 ETH minimum. You assume smart-contract exposure when you use these services.

    Will institutional interest sustain these yields?

    Custody and risk management

    Managing keys remains a requirement for solo stakers. If you run a validator, you must manage signing keys and withdrawal credentials. You can use a hardware wallet to keep withdrawal credentials anchored offline. This ensures exit proceeds land in self-custody. For smaller amounts, you delegate to a service. This introduces trust risk regarding the operator.

    Slashing is a risk for all validators. This occurs if a validator double-signs or misses attestations. Pectra adjusted the initial slashing penalty for large validators under EIP-7251. The penalty changed from 1/32 of the balance to 1/4,096 of the effective balance. If you stake via Lido, you face the risk of smart-contract failure. Lido and Rocket Pool have undergone extensive audits.

    Self-custody holders can use the EIP-7002 exit mechanism to regain control. This function lets you exit your validator without the operator’s help. Exit queues still exist and take one to three weeks. Liquid staking provides instant liquidity through tokens like stETH. This liquidity comes at the cost of contract exposure.

    You should prioritize security. If you run a solo validator, set your withdrawal address to a hardware wallet. For liquid staking, your stETH or rETH sits on your device. Use hardware solutions that keep private keys on a secure element.

  • Bitcoin accumulation at $62,000 support

    Bitcoin accumulation at $62,000 support

    Bitcoin trades near $63,041 on Coinbase after dropping 1.10% for the day. The asset stays between a support zone near $60,000 – $61,400 and resistance around $63,350 – $65,150. Prices dropped from a $82,000 peak in May 2026 to below $60,000 in June 2026 before reaching $64,400. This consolidation suggests a battle between buyers and sellers.

    The technical outlook remains bearish because the price stays below the 50-day EMA at $65,143 and the 200-day EMA at $74,705. TradingView’s daily summary shows 12 sell signals and five buy signals. The 14-day RSI sits at 48.90.

    The market needs a breakout.

    Level Type Price Point (USD) Technical Rationale
    Immediate Resistance $63,347 – $63,373 Short-term EMAs
    Next Resistance $65,143 50-day EMA
    Immediate Support $62,460 Daily low
    Major Support $60,000 – $61,000 Support zone
    Swing Low Support $58,300 Recent low

    Accumulation patterns and whale behavior

    Whales and institutional entities show mixed behavior. Glassnode analysis shows accumulation in wallets holding 100 – 1,000 BTC and 1,000 – 10,000 BTC. However, long-term holders realized losses near $280 million per day, which reached the highest level since December 2022. Large wallets still sell BTC even as others buy the dip.

    Institutional demand remains inconsistent. U.S. spot Bitcoin ETF flows showed $265.7 million in net inflows on July 6, but they recorded $84.9 million in outflows on July 8. The 30-day average for ETF flows remains negative at approximately -$88.9 million per day.

    Large holders add to positions.

    Directly target the support.

    Metric Value Market Context
    RSI (14) 48.90 Neutral territory
    MACD Line -202 Bearish momentum losing strength
    ETF 30-day Flow -$88.9 million Negative average
    Whale Net Change +12k BTC Accumulation in 1k+ BTC wallets

    Buying pressure fights selling pressure.

    The market exhibits higher lows after bouncing from $62,000. Recent dips hold above $64,000 and $65,000. These shallower pullbacks suggest buyers step in earlier. Will liquidity sweep the current range before a move?

    Strategic entry via DCA

    Dollar-cost averaging (DCA) reduces risk during volatility. A $100 weekly DCA strategy yielded a 14.36% advantage in BTC accumulation during historical simulations from 2018 to 2025. A $100 monthly DCA investment during the 2022 – 2024 bear market resulted in a 192.47% return. This approach creates an average purchase price 15.2% lower than the market average.

    Institutional participation follows a structural path. By late 2025, professionally managed Bitcoin exposure exceeded $115 billion. In 2025, 68% of institutional investors allocated capital to BTC exchange-traded products or planned to do so.

    The strategy works.

    A break below $61,300 brings pressure to $60,000.

    Traders watch $65,150.

    The price stays below the 50-day EMA. This indicates a bearish trend. A daily close above $65,150 weakens the bearish case and targets $66,000 or $68,000. If Bitcoin loses $64,000 and breaks below $62,000, the price may drop toward $60,000 or slightly lower. A breach of $58,300 indicates bears regained control, targeting $56,000 and $53,000.

    Does the macro environment allow a breakout?

    The Federal Reserve left rates at 3.50% – 3.75% at its June meeting. Higher rates hurt non-yielding assets. Bitcoin trades like a leveraged tech stock. A drop in stocks or rising oil prices hurts the price. Use DCA to manage entries. Set a stop-loss below $66,000. Stay cautious.