Category: Uncategorized

  • The statistical profile of Real Madrid’s perimeter game

    The statistical profile of Real Madrid’s perimeter game

    Real Madrid produces 10.0 three-point makes per game. This volume helps the team maintain a +5.1 point differential across 44 games. The squad attempts 26.6 three-pointers every game. This frequency results in a 37.7 percent shooting accuracy. The offense remains balanced because four players average double digits.

    The numbers show a shift.

    The statistical profile of Real Madrid's perimeter game (2)

    The 2025-26 season statistics for Real Madrid include 88.1 total points scored and 83.0 points allowed. The team holds a 549.8 total rebound count. They record 19.2 assists and 12.3 turnovers. Defensive pressure results in 3.9 blocks per game. The team also incurs 20.2 personal fouls per game. This high foul rate limits the team’s perimeter control. You should observe how the 3-point shooting frequency shifts the rebounding landscape.

    Long-term shooting trends in professional basketball

    The Montenegrin Journal of Sports Science and Medicine notes that EuroLeague exhibited a higher reliance on three-point shooting with a greater three-point attempt rate and more three-point attempts per 100 possessions than the NBA. This distinction remains a constant in tactical planning. EuroLeague teams also outperformed the NBA in three-point makes and effective field goal percentage. The NBA shows a steeper upward trend in shooting efficiency in recent seasons. The NBA maintains a higher rate of two-point field goal attempts per 100 possessions.

    The NBA also features different scoring distributions. Golden State attempted 43.9 three-pointers per game in 2025. Charlotte attempted 43.5. Boston attempted 42.5. Portland attempted 42.1. Phoenix attempted 40.6. Chicago attempted 40.1. Memphis attempted 39.5. Cleveland attempted 39.5. Atlanta attempted 39.3. Milwaukee attempted 39.1. Brooklyn attempted 38.4. Miami attempted 37.9. Oklahoma City attempted 37.8. Indiana attempted 37.6. San Antonio attempted 37.4. New York attempted 37.4. Utah attempted 36.7. Minnesota attempted 36.4. Washington attempted 36.4. Denver attempted 35.5. Philadelphia attempted 35.0. Orlando attempted 34.0. LA Clippers attempted 33.8. LA Lakers attempted 32.3. New Orleans attempted 32.1. Toronto attempted 31.9. Dallas attempted 31.9. Houston attempted 31.6. Detroit attempted 30.8. Sacramento attempted 30.2.

    Offensive efficiency and roster construction

    Real Madrid relies on a spread scoring model. Theo Maledon averages 11.7 points in his debut EuroLeague season. Facundo Campazzo averages 12.1 points. Trey Lyles averaged 14 points. Mario Hezonja averaged 12.5 points. The team lost Hezonja and Lyles during the summer transfer market. The squad added Mikael Jantunen, Eli Ndiaye, and Olivier Sarr. Jantunen is 26 years old and weighs 100 kg. Ndiaye is 22 years old and weighs 95 kg. Sarr is 27 years old and weighs 109 kg.

    The roster contains several veteran players. Sergio Llull is 38 years old and weighs 94 kg. Edy Tavares is 34 years old and weighs 125 kg. Damian Jones is 31 years old and weighs 111 kg. Gabriel Deck is 31 years old and weighs 105 kg. Alberto Abalde is 30 years old and weighs 95 kg. Timothe Luwawu-Cabarrot is 31 years old and weighs 98 kg. Chuma Okeke is 28 years old and weighs 104 kg.

    Will the departure of Mario Hezonja diminish the scoring depth of this perimeter-heavy offense?

    Rebounding dynamics and three-point volume

    Three-point shots create more long rebounds than two-point attempts. Paris Basketball uses a "tagging up" strategy to exploit this trend. This strategy involves all five offensive players going to the high side of their matchup during a shot attempt. Paris Basketball takes the most three-pointers per game in the EuroLeague. This volume allows them to secure 39.9 percent of offensive rebounds. They lead the league with 12.6 offensive rebounds per game.

    Madrid maintains a different statistical profile. The team records 11.9 offensive rebounds and 25.8 defensive rebounds. This total results in 37.7 total rebounds per game. The team relies on Edy Tavares, who is 2.20 m tall, to anchor the presence near the rim. Usman Garuba is 2.03 m tall and weighs 115 kg. Jaime Pradilla is 2.05 m tall and weighs 106 kg.

    Tactical execution through after timeout plays

    Coaches use after timeout plays to create scoring opportunities. These plays exploit defensive vulnerabilities. Barcelona uses the "Barcelona Chin to Back Screen" play. In this set, player 1 passes to player 4. Player 4 executes a dribble handoff with player 1. Player 1 cuts to the paint and sets a back screen for player 5. This movement creates space for player 3 on the left wing.

    Effective execution requires communication. Players must understand their roles in these sets. Success depends on precise movements. Madrid also faces opponents like Barcelona, who use specific offensive sets to create space. Madrid won the last three EuroLeague Clasicos since November 28, 2024. These scores were 90-97, 96-91, and 92-101. The overall European record in Madrid favors the home side 21-18.

    Player profiles in the perimeter rotation

    The Madrid rotation includes specific shooters. Max Shulga is 24 years old and weighs 95 kg. Gabriele Procida is 24 years old and weighs 88 kg. Both players provide options for the perimeter. Facundo Campazzo is 35 years old and weighs 84 kg. He leads the backcourt in scoring frequency.

    The bench provides depth. Mikael Jantunen is 26 years old. Eli Ndiaye is 22 years old. Olivier Sarr is 27 years old. These players support the starters. The team relies on the experience of Sergio Llull, who has scored 11,515 points in his career. Llull has played in 1,084 matches.

    Player Position Age Height Weight
    Facundo Campazzo PG 35 1.78 m 84 kg
    Theo Maledon PG 25 1.93 m 79 kg
    Sergio Llull SG/PG 38 1.90 m 94 kg
    Gabriel Deck PF/SF 31 1.98 m 105 kg
    Edy Tavares C 34 2.20 m 125 kg
    Jaime Pradilla PF/C 25 2.05 m 106 kg
    Chuma Okeke PF/SF 28 2.01 m 104 kg
    Alberto Abalde SF/SG 30 2.02 m 95 kg

    Comparative efficiency of Madrid’s shooting

    Madrid’s shooting metrics show high efficiency. The team hits 56.0 percent of its two-point field goals. This comes from 37.1 two-point attempts per game. Their three-point shooting hits 37.7 percent. This efficiency is a result of 26.6 three-point attempts. The team also converts 78.9 percent of its free throws. This total comes from 20.8 free throw attempts per game.

    I find the team’s perimeter dependency too high. The squad scores 88.1 points while opponents score 83.0. This margin relies on the ability to convert long rebounds. Madrid also has 19.2 assists per game. This passing supports the perimeter rotation.

    The scoring is even.

    Context of the European basketball market

    The 2026 transfer market is intensifying. Dubai Basketball signed Toko Shengelia from Barcelona. Dubai also signed Mamadi Diakite and Davion Mintz. Xavi Pascual is the head coach for Dubai. The EuroLeague rosters include many changes.

    Fenerbahce Beko Istanbul signed Shavon Shields and Will Clyburn. Zalgiris Kaunas signed Jonas Valanciunas and Marius Grigonis. Maccabi Rapyd Tel Aviv remains a competitive force. Olympiacos Piraeus signed Codi Miller-McIntyre and Evan Fournier.

    Madrid maintains its position through veteran stability. Sergio Llull remains the captain. The team remains a consistent force in the EuroLeague standings. They have 11 EuroLeague titles. These titles include seasons from 1963-64 to 2022-23. The team also holds 38 Spanish League titles.

    Madrid hits shots. The stats stay. They win games.

  • Understanding Ethereum ETF staking yields and fee structures

    Understanding Ethereum ETF staking yields and fee structures

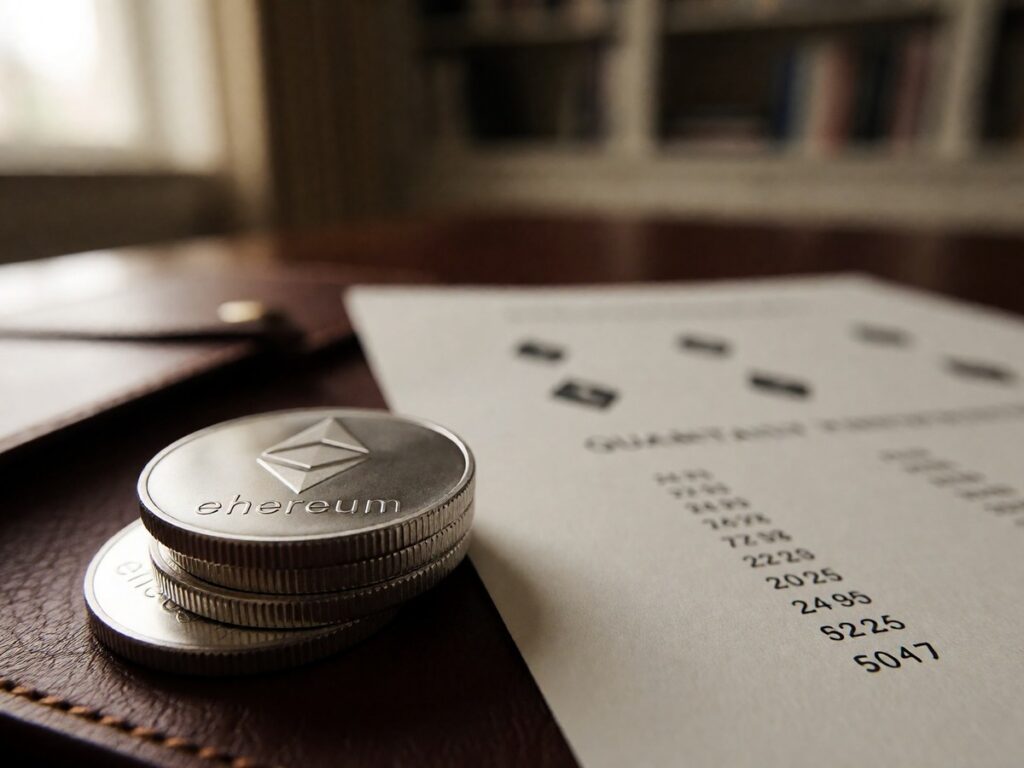
    BlackRock’s iShares Staked Ethereum Trust (ETHB) launched on Nasdaq on March 12, 2026, and reached $254 million in assets within its first week of trading. The fund stakes between 70% and 95% of its holdings through providers like Coinbase Prime, Figment, Galaxy Digital, and Attestant. After BlackRock takes an 18% service fee from gross staking rewards and charges a 0.25% annual sponsor fee, investors receive approximately 1.9% to 2.4% net annually. This fee is a 0.12% promotional rate for the first year on the first $2.5 billion in assets. The shift to staking ETFs transforms Ethereum from a passive asset into a productive yield-bearing instrument.

    Ethereum has faced a difficult 2026. ETH trades near $1,767 as of July 6, 2026, which is far below the bullish expectations of 2024. Citi cut its 12-month Ether target from $3,175 to $2,240 because of negative ETF flows and weak investor demand. The ETH/BTC ratio sits near 0.030 as of March 2026, which is a multi-year low.

    Understanding Ethereum ETF staking yields and fee structures (2)

    The fee war defines the market.

    The competition between issuers

    The Ethereum ETF market spent 2024 and 2025 competing on fees. BlackRock’s iShares Ethereum Trust (ETHA) charges 0.25%, and Fidelity’s Ethereum Fund matches that rate. VanEck undercuts them at 0.20%, and Franklin Templeton offers 0.19%. Staking changes the competition from management fees to yield spreads.

    Grayscale’s ETHE charges a 1.50% annual fee, which is six times what BlackRock charges. Grayscale distributed $9.4 million in staking rewards to investors on January 6, 2026. That payout was $0.083178 per share for rewards earned between October 6, 2025, and December 31, 2025.

    Fidelity filed an amendment to its FETH fund on August 11, 2026. The fund holds roughly $900 million in net assets. Fidelity will retain 85% of staking rewards and give 15% to service providers. The fund also has a 0.25% annual management fee.

    Fidelity’s FETH staking reward split provides 85% to shareholders.

    Regulatory developments

    The SEC and CFTC issued a joint interpretive release on March 17, 2026. This release classified staking rewards from 16 digital commodities, including ETH, as non-securities. The decision removed the legal barrier that prevented issuers from activating staking features. Before this, the SEC instructed issuers to remove staking from their filings. Now, the regulatory environment is more receptive to these products.

    The IRS issued Revenue Procedure 2025-31 on November 10, 2025. This procedure provides a safe harbor for exchange-traded products to stake proof-of-stake assets and distribute rewards. The safe harbor includes a 14-condition checklist covering custody, liquidity, and slashing. The transition window for existing trusts to adopt these rules expired on August 10, 2026.

    Tax rules change everything.

    Validator infrastructure and risks

    Staking ETFs use third-party validators to secure the network. BlackRock’s ETHB uses Coinbase Prime, Figment, Galaxy Digital, and Attestant. Fidelity’s FETH uses Blockdaemon, Figment, and Galaxy Digital Trading Cayman. Galaxy Digital and Figment serve as validators for multiple large U.S. Ethereum ETFs.

    This concentration creates risk. If a validator provider experiences a software bug or an outage, multiple funds feel the impact. Slashing is a real risk where the protocol destroys a portion of staked ETH for validator errors. Fidelity’s prospectus acknowledges that a slashing event results in an immediate reduction of the staked ether.

    Unbonding periods also create liquidity issues. Ethereum requires a waiting period to unstake assets that ranges from 9 to 50 days. Because of this, BlackRock stakes only 70% to 95% of its holdings. The remaining portion acts as a liquidity buffer for redemptions.

    Tax implications for holders

    The IRS treats staking rewards as ordinary income. Under Revenue Ruling 2023-14, rewards are taxable at fair market value when a user gains dominion and control. This applies to direct validators and exchange users alike.

    You should evaluate the fee math.

    When an investor sells a reward, they face capital gains taxes. The cost basis for the reward is the fair market value on the day of receipt. If you hold the reward for more than one year, you pay long-term capital gains rates. These rates are 0%, 15%, or 20% depending on your income.

    If you receive 2 ETH as staking rewards when ETH is at $2,500, you report $5,000 as ordinary income and that amount becomes your cost basis for the reward tokens.

    Parameter BlackRock ETHB Fidelity FETH Grayscale ETHE Direct Staking
    Net Annual Yield 1.9% to 2.4% ~2.2% Variable 3.1% to 3.3%
    Sponsor Fee 0.25% 0.25% 1.50% 0%
    Reward Share 82% to holders 85% to holders Variable 100% to holders
    Payout Frequency Monthly Quarterly Variable Varies

    Yield comparison and math

    Direct staking offers the highest yield. Ethereum’s network currently provides a gross annualized yield between 3.1% and 3.3%. Some validators earn more through execution-layer rewards like transaction fees and MEV.

    ETF yields are lower because of fees. BlackRock retains 18% of gross staking rewards. Fidelity retains 15% of gross rewards.

    If an investor holds a fund earning 2.2% net staking yield, the payout on a $10,000 position equals roughly $220 per year before the volatility of the price moves the USD-equivalent amount higher or lower each quarter.

    Comparing these options requires looking at the total return.

    Feature ETF Staking Liquid Staking (stETH) Direct Staking
    Accessibility High (Brokerage) Medium (DeFi) Low (Technical)
    Yield Efficiency Low (Fees apply) Medium High
    Tax Complexity Low (1099-DA) High (Daily/Rebase) High (Manual)
    Slashing Risk Managed by Fund Protocol Risk Full Risk

    Staking vs direct ownership

    Staking ETFs are different from direct ETH ownership. Direct holders earn the full network yield. They also maintain full control over their private keys.

    Staking ETFs provide convenience. They work in IRAs and 401(k) accounts. They use institutional-grade custodians like Anchorage Digital and BitGo. The fund manages the technical tasks of validator selection and slashing protection.

    The yield gap is the main cost. Grayscale’s ETHE fee is 1.50% annually. BlackRock’s ETHB fee is 0.25% annually. For many, the 18% reward fee paid to BlackRock is the price of regulatory safety.

    Will the SEC approve the next wave of filings?

    Market dynamics and decision making

    The Ethereum market is split. ETH is the dominant Layer 1 for DeFi with over 85% of the total value locked. It is the primary network for the $19.8 billion RWA tokenization sector.

    However, price action can undermine yield. In early 2026, ETH fell 46% from its August 2025 high. During this period, staking income for some products was erased by the price drop. A 3% staking reward does not protect an investor if the asset price falls 30%.

    Investors face fees, technical risks, tax complexities, and regulatory hurdles.

    The decision depends on the investor profile. Institutional managers often prefer the BlackRock or Fidelity models because they can defend a regulated product in a portfolio. They accept lower net yields for the ability to hold ETH in a brokerage account.

    Crypto-native investors often prefer direct staking or liquid staking protocols. They want the 3.1% to 3.3% gross yield without paying a service fee to a fund manager. They can manage the 9 to 50 day unbonding period themselves.

    Investors must decide if the convenience of a regulated wrapper outweighs the higher yields found in direct staking.

  • The people shaping the Fed’s 2026 inflation fight

    The people shaping the Fed’s 2026 inflation fight

    The Federal Open Market Committee voted 9-3 to keep the federal funds rate in a range between 3.5% and 3.75% in June. Three regional presidents – Beth Hammack, Neel Kashkari, and Lorie Logan – voted against this decision. They preferred to raise the target range for the federal funds rate by 0.25 percentage points at that meeting. These dissenters argued that inflation remains above the 2% target after five years of elevated readings. The committee faces a split between those prioritizing labor market stability and those fearing a return of inflation.

    The policy split remains deep.

    Governor Adriana Kugler monitors how trade policy changes influence inflation. A 20 percentage point increase in tariffs on Chinese imports earlier this year raised core PCE prices by 0.2 percent from February through April. Core goods inflation rose at a 0.2 percent annual rate in the 12 months through April. This is a reversal from April 2024, when core goods prices fell 0.5 percent over the previous 12 months. She notes that the pass-through of tariffs into prices happens quickly. Higher tariffs on other countries could also raise inflation for the rest of the year.

    Kugler also examines services inflation. The PCE price index for housing services fell from 5.7 percent in April 2024 to 4.2 percent in April 2025. Core services excluding housing fell from 3.6 percent in April 2024 to 3 percent in April 2025. While these figures show disinflation, they remain above pre-pandemic levels. The FOMC’s preferred inflation gauge grew at 2.1 percent in April, but energy price declines dragged this number down. Core inflation was 2.5 percent in April.

    Vice Chair Philip Jefferson views the economy with cautious optimism. Gross domestic product rose at an annual rate of 4.3 percent in the third quarter of 2025. This growth followed a sharp acceleration in the first half of last year. Jefferson expects the economy to expand at a rate of about 2 percent in the near term. He believes current policy sits in a range consistent with the neutral rate.

    The labor market shows signs of stability. Job growth moderated last year, and the unemployment rate edged higher. The unemployment rate ended 2025 at 4.4 percent, which was an increase from the 4.1 percent rate at the end of 2024. In November and December 2025, employers added about 50,000 jobs to payrolls each month. This followed a decline in payrolls in October. Jefferson noted that there were 0.9 available jobs in November for every unemployed American. This ratio is lower than the levels seen during the pandemic recovery.

    Internal disagreements among governors signal a lack of unity. Governor Michelle Bowman dissented in September 2024, preferring a 25-basis-point rate cut. Stephen Miran dissented in three meetings, calling for 50-basis-point cuts. Miran’s term ends on January 31, 2026.

    The disagreement between governors and regional presidents creates a difficult environment for policy planning.

    Policy Member Perceived Tilt
    Beth Hammack Hawkish
    Neel Kashkari Neutral
    Lorie Logan Hawkish

    Beth Hammack and Lorie Logan favor more restrictive policy. Hammack believes that easing policy could support risky lending and increase financial stability risks. She says inflation is trending in the wrong direction. She also argues that easing policy could boost valuations and delay the discovery of weak lending practices in credit markets.

    The committee must weigh these views.

    The labor market remains resilient. Employers added 177,000 jobs in April. The unemployment rate was 4.2 percent in April, which is within the 4 percent to 4.2 percent range seen since May 2024. This rate is stable. Private-sector forecasters predicted 130,000 new jobs for May.

    While layoffs remained low through the final week of May, other measures suggest modest increases. Worker Adjustment and Retraining Notifications of layoffs have increased since the beginning of the year. Mentions of layoffs in the Fed’s Beige Book survey and Challenger, Gray and Christmas data also increased. The vacancy rate was 4.4 percent in April. This is down from a peak of 7.4 percent three years ago. The quits rate was between 1.9 and 2.2 percent.

    Consumers expect prices to continue rising. The July 2026 Survey of Consumer Expectations shows one-year inflation expectations at 3.6 percent. Median inflation uncertainty at the one-year and five-year horizons decreased.

    Consumer Expectation July 2026 Value
    One-Year Inflation 3.6%
    Three-Year Inflation 3.3%
    Five-Year Inflation 3.0%
    Gas Price Growth 2.9%
    Rent Growth 5.9%
    Medical Care Growth 8.9%

    Gas price growth expectations reached 2.9 percent. Rent expectations were 5.9 percent. Medical care expectations were 8.9 percent. Food expectations remained at 5.0 percent. Home price growth expectations were 3.2 percent.

    You should watch the upcoming data revisions.

    The probability of losing a job in the next 12 months is 14.2 percent. This is below the 12-month trailing average of 14.5 percent. The probability of finding a job if a person loses their current job is 46.2 percent. This figure is higher for those with at most a high school degree. The probability of leaving a job voluntarily is 18.6 percent.

    Inflation remains high.

    The Supreme Court ruled in favor of Governor Lisa Cook in the Trump v. Cook case. The court blocked the President’s attempt to remove her without cause. Chief Justice Roberts said that accepting the government’s position would transform the for-cause protection into at-will employment. He said this would be an interpretive leap out of step with the statute.

    The ruling protects the independence of the Federal Reserve. The decision ensures that the President cannot easily pack the board with loyalists. This case arrived after the White House issued an order of removal for Cook last August. A federal court had blocked that order. The Supreme Court decision prevents the President from using manufactured pretexts to influence interest rate decisions.

    The policy split remains deep.

  • The London Metal Exchange nickel crisis and lasting reforms

    The London Metal Exchange nickel crisis and lasting reforms

    Nickel prices at the London Metal Exchange surged by more than 100 percent to exceed US$101,365 per ton in early March 2022. Before this spike, rangebound trading rarely broke above the $20,000 per metric ton mark. Prices rose to $25,000 in January before easing by the end of the month. They moved higher again in February before the Russian invasion of Ukraine. Russia provides about 10 percent of the global nickel supply. The conflict triggered supply concerns and drove prices up by 96 percent compared to pre-invasion levels. This volatility follows a long history of price shifts. In the 1970s, large producers like INCO, Falconbridge, and Societe Le Nickel controlled 75 percent of world nickel demand. They set prices using producer lists. A 1969 strike in Canada caused shortages and price spikes, which made buyers lose faith in those lists. By 1982, the industry switched to LME prices because producer prices collapsed.

    The LME intervention was necessary.

    The short squeeze intensified when Tsingshan Holding Group attempted to cover its massive position. Xiang Guangda, the founder of the world’s largest nickel and stainless-steel firm, held a short position of more than 150,000 tonnes of nickel. This volume equaled approximately one-eighth of all LME outstanding contracts at its peak. Only one-fifth of the total nickel exposure was visible to the exchange because the rest was held in private over-the-counter trades. These trades involved banks such as JPMorgan Chase, BNP Paribas, Standard Chartered, and United Overseas Bank Ltd. Tsingshan produced nickel pig iron with 10 percent nickel content and high nickel matte with 70 percent content. These products do not meet the LME requirement of 99.80% purity. This mismatch creates basis risk and delivery risk. A short seller faces basis risk when spot and futures prices deviate. Delivery risk occurs when a trader cannot provide physical metal before a contract expires. The surge in prices caused an $8 billion margin call for Xiang Guangda.

    The market eventually recovered.

    The LME suspended all nickel trading on March 8, 2022, at 8:15 am. The exchange then cancelled all nickel trades executed on or after midnight local time that day. This decision transferred approximately $27.4 billion from long position holders to short position holders. The aggregate value of these cancelled trades was approximately $12 billion. If the LME had allowed prices to stand at over $100,000, Tsingshan would have owed an estimated $15 billion. The exchange argued that the market became disorderly and that allowing the trades would create systemic risk. The decision effectively bailed out investors like Tsingshan and clearing members that could not transfer the required margin.

    The LME’s decision remains controversial.

    The Administrative Court dismissed judicial review proceedings brought by Elliott Associates LP and Jane Street against the LME. These claimants argued the LME lacked the power to cancel trades. The court held that the LME’s decision to cancel the nickel trades was not unlawful, as the LME rules provided the exchange with specific powers to manage market integrity during periods of extreme volatility. Rule 22 allows the exchange to cancel, vary, or correct any Agreed Trade or Contract if the exchange considers it appropriate. The court also found that the LME did not act for an improper purpose. The decision to ensure an orderly market and prevent multiple member defaults was valid. The judges noted the urgency of the situation on March 8, 2022, made consultation with claimants unnecessary. You should understand that the LME’s authority rests on private contract law.

    The FCA investigated the exchange.

    The Financial Conduct Authority concluded its investigation in early 2025. The regulator imposed a £9.2 million fine on the LME for regulatory failures. The FCA found that the LME rulebook lacked clear provisions for suspending trading or cancelling trades during extreme circumstances. Governance arrangements were inadequate for making decisions of such significance under time pressure. The regulator also found that the LME did not have adequate arrangements to monitor and manage risks from concentrated positions. The exchange was described as being asleep at the wheel.

    The LME introduced new volatility and price control frameworks. The exchange uses daily price limits, static price bands, and dynamic price bands. For nickel, the current 3-month outright daily price limit is 15 percent. This limit is a fixed percentage of the previous day’s 3-month closing price. The dynamic price bands move in line with the last traded price plus or minus a USD value. Static price bands refresh hourly based on an anchor price. In 2023, the LME began requiring members to disclose their over-the-counter nickel positions on a weekly basis. This measure helps the exchange monitor position concentrations across both exchange and off-exchange markets.

    Contract Current 3M Outright Daily Price Limit
    LME Nickel 15%
    LME Aluminium 12%
    LME Copper 12%
    LME Zinc 12%
    LME Lead 12%
    LME Tin 15%
    LME Cobalt 15%

    Nickel trading volumes returned to pre-crisis levels by late 2024. Average daily volume for nickel reached 60,991 lots in the first quarter of 2026. This is a 75 percent increase over the 34,840 lots traded in Q1 2023. The LME added four physical suppliers to its network, which can provide up to 100,000 metric tons of additional stock. These suppliers are primarily Chinese refiners using Indonesian nickel ore. The exchange also expanded its warehouse network to include Jeddah, Saudi Arabia, and additional capacity in Hong Kong.

    The recovery is steady.

    The LME faces new competition from the Shanghai Futures Exchange and the CME Group. The SHFE allows overseas traders to trade nickel futures and options. A startup called Abaxx is building infrastructure to offer a futures contract based on nickel sulphate. Another company, Global Commodities Holdings Limited, plans to launch a platform for spot trading in physical nickel. This company is led by former LME CEO Martin Abbott. Brokers remain cautious regarding Tsingshan. Some firms, including JPMorgan Chase & Co., stopped trading for the company. The LME clearinghouse also charges concentration margin for nickel positions exceeding a few thousand tons. Will the emergence of new competitors like Abaxx actually erode the LME’s dominance? The LME continues to manage the tension between market stability and the growing demand for competitive pricing alternatives.

  • LeBron James: separating Lakers farewell myths from 2026 impact

    LeBron James: separating Lakers farewell myths from 2026 impact

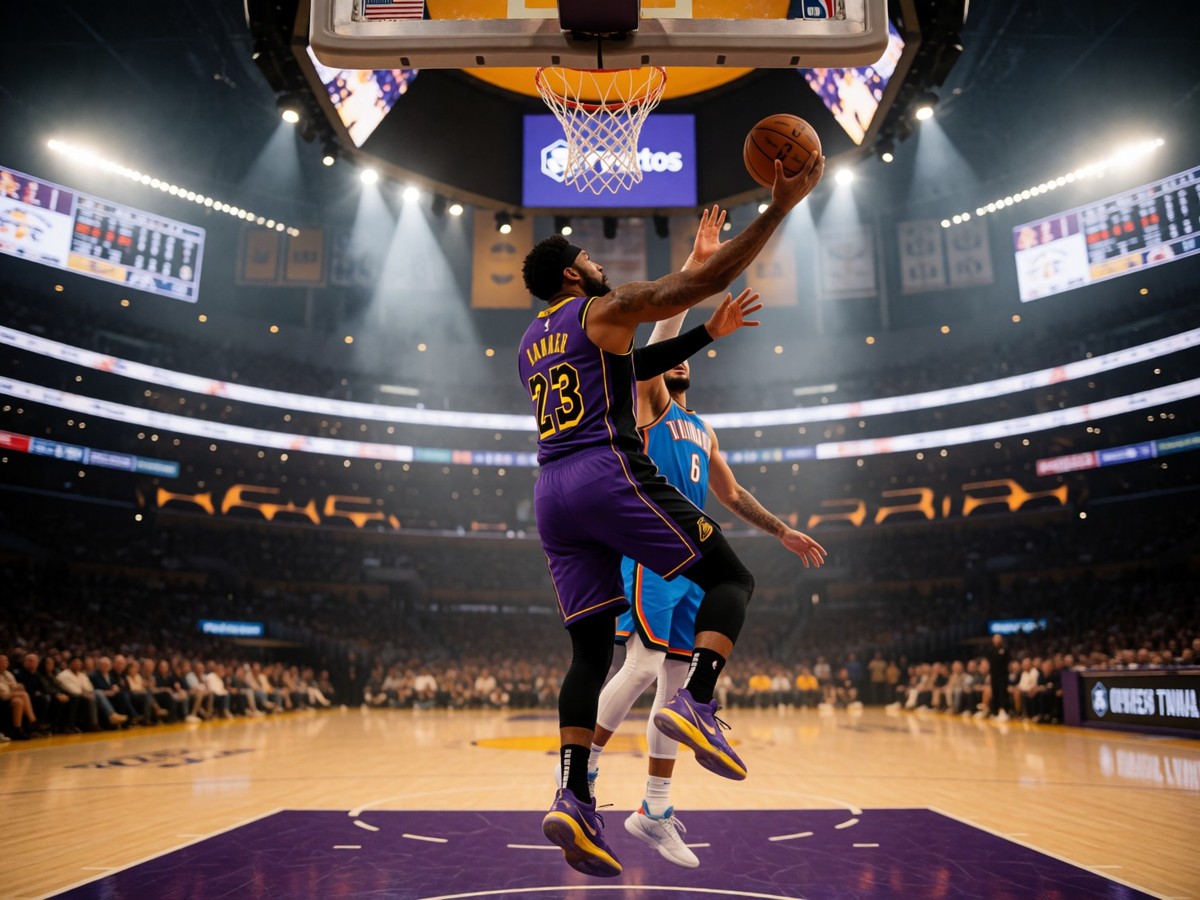
    The Los Angeles Lakers season ended in a four-game sweep by the Oklahoma City Thunder. This exit triggered widespread speculation regarding LeBron James’ retirement. A social media teaser titled "The Second Decision" caused much debate. The post mimicked his 2010 announcement regarding the Cleveland Cavaliers. Instead of a retirement plan, the video served as an advertisement for Hennessy. The video showed James walking into an interview setting on a basketball court. A man sat in a chair waiting for him. The caption read, "The decision of all decisions." This teased the 2010 event. The Kalshi prediction market recorded $429,529 in trades since June 14. Traders gave James a 25.6% chance of retiring before the 2026-27 season. This probability fell from a peak of 46% in mid-January. The rumors subsided.

    LeBron James remains an elite force. He averaged 23.2 points, 6.7 rebounds, and 7.3 assists over 10 playoff games this season. On May 11, 2026, he recorded 40 points, 24 rebounds, and 12 assists against the Thunder. He also grabbed 3 steals in that contest. Four days earlier, he earned 19 points and 6 rebounds in a game where he recorded 8 steals. He also grabbed 23 rebounds and scored 23 points on May 7, 2026. On April 24, 2026, he provided 29 points, 13 rebounds, and 13 assists. He recorded 6 steals during that performance. On April 18, 2026, he notched 19 points, 8 rebounds, and 8 assists alongside 13 steals. His scoring reached 28 points on May 1, 2026, while he grabbed 7 rebounds and 8 assists. He also recorded 8 steals in that game. On April 21, 2026, he scored 28 points and 8 assists with 7 steals. On April 29, 2026, he scored 25 points and 3 rebounds. On April 26, 2026, he scored 10 points and 4 rebounds. On April 24, 2026, he scored 29 points. The stats stand.

    Coach JJ Redick utilized specific rotation patterns to manage the Lakers’ star trio. The team often played Luka Doncic and Austin Reaves together without James. These lineups outscored opponents by 11.9 points per 100 possessions. You already know the Lakers’ recent struggles. In contrast, lineups featuring James and Reaves without Doncic fell behind opponents by 4.2 points per 100 possessions. When only one star played, James-led units outperformed those led by Doncic or Reaves. The Lakers finished the regular season with a 53-29 record. They finished 4th in the Western Conference. The Oklahoma City Thunder finished with a 64-18 record. The San Antonio Spurs finished 62-20. The Denver Nuggets finished 54-28. The Houston Rockets finished 52-30. The Minnesota Timberwolves finished 49-33. The Phoenix Suns finished 45-37.

    Physicality remains a concern for the 41-year-old forward. James missed the first month of the season because of sciatica on his right side. Redick intends for James to play approximately 35 minutes per game when he reaches full speed. James expressed dissatisfaction with limited playing time in a Netflix documentary. He stated he hates playing only 29 minutes. He continues his battle with Father Time. He told host Taylor Rooks that he is kicking his bum. He also said Father Time can go to somebody else because he already lost to him. The Lakers failed to make the third round of the playoffs for a third straight year. This failure highlights the difficulty of maintaining championship contention. LeBron is 41. He is a veteran. He has played at least 45 regular-season games each year of his career. He played 60 games this season. He did not miss a playoff game.

    Advanced metrics separate James from his peers. He recorded five postseasons with a player efficiency rating of at least 30.0. He also achieved five postseasons with win shares per 48 minutes of at least 0.270. His eight postseasons with a box plus-minus of at least 10.0 match the totals of Michael Jordan. He also earned five postseasons with a value over replacement player of at least 2.5. No one else came close in those categories. His regular season performance showed 20.9 points, 6.1 rebounds, and 7.2 assists. His field goal percentage reached .515. His three-point percentage reached .317. His free throw percentage reached .737. He earned Player of the Week honors in November 2004, January 2005, March 2006, November 2006, January 2008, November 2008, February 2009, January 2010, February 2011, April 2012, February 2013, December 2013, January 2015, March 2016, December 2016, February 2017, March 2018, January 2020, and April 2026.

    Advanced Metric LeBron James Value
    Postseasons with PER $ge$ 30.0 5
    Postseasons with WS/48 $ge$ 0.270 5
    Postseasons with BPM $ge$ 10.0 8
    Postseasons with VORP $ge$ 2.5 5

    The Lakers roster faces a summer of decision making. Bronny James averaged 2.9 points, 1.2 assists, and 0.5 rebounds over 42 regular-season games. He played 5.3 minutes per game in the playoffs. He did not play in Game 4 against the Thunder. Bryce James took a redshirt year as a freshman at Arizona. He must wait until the 2027 NBA Draft. The team scheduled an October 21 opener against the Golden State Warriors. Will LeBron James sign a new contract with the Lakers? He turns 42 in mid-December. He has 22 years of NBA experience. The roster includes players like Rui Hachimura, Austin Reaves, and Dalton Knecht. They also feature players like Jaxson Hayes and Jake LaRavia. He stays ready.

  • China’s August stimulus pivot and the copper-AUD connection

    China’s August stimulus pivot and the copper-AUD connection

    Copper prices slide as stimulus doubts grow

    Copper prices gave back 50% of the gains from Chinese stimulus announcements. Traders question the scale and speed of these initiatives. The gold-to-copper ratio fell to 3.52, a level last seen in 2020. LME copper trades around USD 9,450 per ton. As China consumes 50% of the global copper supply, the falling gold-to-copper ratio signals economic distress and high uncertainty, which supports gold prices through concerns regarding fiscal profligacy and incoming US interest rate cuts. Prices fell sharply. The copper rally is a dead cat bounce.

    China sets aggressive growth targets

    The government aims for a GDP growth target of 4.5 to 5 percent this year. Finance Minister Lan Fo’an expects fiscal expenditure, new government bond issuance, and central transfers to reach record highs. Total investment in infrastructure, power grids, computing power, education, and health care will exceed 7 trillion yuan. A 250 billion yuan fund supports consumer goods trade-in programs. Another 100 billion yuan supports private investment and consumer spending. Nearly 1.3 trillion yuan supports science and technology development, representing a 7.1 percent increase from 2025. AI-related industries will exceed 10 trillion yuan by the end of the 15th Five-Year Plan period. Six emerging pillar industries, including integrated circuits, the low-altitude economy, and intelligent robots, will surpass 10 trillion yuan in 2030. High-tech manufacturing drove 26 percent of industrial growth last year.

    China's August stimulus pivot and the copper-AUD connection (2)

    The policy shift targets 5% growth.

    Australian dollar correlation with copper

    The Australian dollar trades with a 0.89 correlation to COMEX copper futures. The correlation between AUD/USD and USD/CNH is -0.87. AUD/USD broke through resistance at 0.6550. RBA Governor Michele Bullock noted a 0.6% core inflation forecast for the September quarter. Implied pricing for a November rate cut fell to 37%. Demand stays low.

    Aussie is a proxy.

    The Australian dollar moves with macro sentiment and trade optimism. Michele Bullock stated the board needs more data before deciding on policy moves. A 0.9% rise in core inflation is a material miss against the 0.6% forecast. The median view for the quarterly trimmed mean inflation rate is 0.8%. You should monitor the 0.6625 resistance level.

    Real estate contraction drags industrial demand

    China’s real estate development investment totaled 3,035.6 billion RMB from January to May 2026, a 16.2 percent year-on-year decrease. Residential investment was 2,342.6 billion RMB, down 15.6 percent. The floor space under construction was 5,487.75 million square meters, a 12.3 percent decrease. Residential floor space under construction was 3,808.30 million square meters, a 12.6 percent decrease. New construction starts totaled 179.29 million square meters, a 22.6 percent decrease. Residential new starts were 130.84 million square meters, a 23.4 percent decrease. Completed floor space reached 140.87 million square meters, a 23.4 percent decrease. Residential completions were 99.99 million square meters, a 25.0 percent decrease. Copper consumption in the real estate sector was 939.7kt, a 2.38 percent year-on-year decline.

    Mining supply constraints

    Mining supply remains tight. Chile’s Escondida mine produces 15% of global copper. BHP expects Escondida to produce 1.2 million tonnes. A strike at Escondida is certain. LME copper stocks provide two days of global supply. Chinese bonded warehouse stocks fell to 37,000 tonnes in September. Russia produces 920,000 tonnes of refined copper. Nornickel produces 406,841 tonnes.

    The global market faces supply pressure. LME consultation on Russian metal creates uncertainty. Workers at Chuquicamata, a Codelco mine with 330,000 tonnes of output last year, down tools. China accounts for 50% of global copper smelting capacity. Smelter fees fell to USD 0 per tonne in 2026.

    Trading the commodity divergence

    The RBA cash rate was 3.85% after the February 2026 hike. Inflation rose 3.8% in the second half of 2025. Michele Bullock noted that a 0.9% rise in core inflation is a material miss against the 0.6% forecast. The median view for the quarterly trimmed mean inflation rate is 0.8%. Implied pricing for a November rate cut is 37%. The AUD/USD broke through resistance at 0.6550. Traders target 0.6625 and 0.6700 as potential options. Will the RBA pivot before the next inflation report?

  • The numbers behind Germany’s defensive identity under Gordon Herbert

    The defensive architect

    Gordon Herbert builds defenses around fundamental positioning. He taught these principles at Fraport Skyliners for more than half of their existence. He won the 2004 BBL title with that team. He also led them to the 2016 FIBA Europe Cup title. He knows how to get the most from players on limited budgets. He previously coached in the VTB league with Avtodor Saratov. The VTB league included coaches from Spain, Greece, Lithuania, Croatia, and Serbia. He also coached the Canadian national team and the Georgian national team. His defensive mastery is a staple of his reputation.

    He coached in Wurzburg in 2000. He returned to Frankfurt in 2010 and again from 2013 to 2019. He also held coaching positions in France and Greece. He worked as an assistant coach for the Toronto Raptors during the 2008/2009 season. He understands how to build defensive intensity.

    He is a defensive specialist.

    The qualifying numbers

    The numbers from the qualifying period reveal a team that recovers from setbacks. Germany lost its first game in the qualifying round to Estonia. The team then won ten games and lost two. Herbert met Dennis Schroder in Braunschweig in September 2021 to discuss the future of the German national team and establish the foundation for the success they would eventually achieve during the 2023 World Cup. They talked for three to four hours. This meeting began the momentum for the squad. The roster included Isaac Bonga and Johannes Voigtmann during the June windows. These players helped the team navigate the qualification process.

    The team relies on a core of players between 24 and 30 years old. You know the roster well.

    The tactical manual

    Herbert teaches defense through specific drills. He uses 4-on-0 drills to teach offensive rebounding and defensive transition. He teaches 5-on-0 drills with ball screens and without ball screens. He wants the team to stay organized. He focuses on angles and spacing. He does not use the Scram Switches that Roy Rana used with the previous German team. Herbert uses his own philosophy. He focuses on containing the dribble and containing the first step. He forbids direct line drives. Players maintain a wide base in their stance. They keep their heads straight and down. This creates a presence that intimidates offensive players.

    He emphasizes three specific tenets. He tells players to guard their position. He tells players to rebound their position. He requires them to execute in the half court offense. He also tells them to cut off the ball as soon as they see a defender’s back. He avoids letting one player guard the strong side while another helps. He prefers changing the angle or using a cutter instead.

    Measuring the 2023 performance

    The 2023 World Cup numbers show Germany’s ability to win close games. They beat the USA 113-111 in the semifinals. This win was the first time the team reached a semifinal. Johannes Voigtmann played a major role in that victory. He recorded 12 points and 8 rebounds. He also provided 3 assists. His efficiency rating was 22. He shot 4-of-5 from the field. Dennis Schroder scored 28 points. He hit 4 of 26 field goals. Germany also beat Serbia in a close contest.

    The team has four players who play in the NBA. Johannes Voigtmann and Danilo Barthel have significant experience. They won the 2016 FIBA Europe Cup together. Isaac Bonga and Leon Kratzer are also part of the core. Herbert reached out to 80% of the players. He views building the roster as a puzzle. He needs different pieces to succeed.

    Player Points Rebounds Assists Efficiency
    Johannes Voigtmann 12 8 3 22
    Dennis Schroder 28 0 0 0

    The personnel and the philosophy

    Herbert works with players who want to make an investment in themselves. He emphasizes technique. He believes technique helps an average defender gain confidence. He focuses on stance, head position, and a wide base. This creates a presence. The team must be unified to play together. He also focuses on defensive transition. He wants five players inside the three-point line after a missed shot. This allows the team to command the ball.

    The team relies on players like Danilo Barthel and Johannes Voigtmann. They developed together in Frankfurt. The roster composition changed over time. The team moved past the era of Dirk Nowitzki. It moved past the era where NBA players were ineligible. Now, the team uses a mix of veterans and young talent.

    The defensive identity remains a priority.

    Will this defensive intensity remain high enough to win gold against the world’s most elite offensive rosters?

  • The future of Japan’s TOPIX rebalance and Buffett’s trading houses

    The future of Japan’s TOPIX rebalance and Buffett’s trading houses

    Berkshire Hathaway crossed the 10% voting threshold in Sumitomo Corp and Marubeni Corp on May 7, 2026. The conglomerate now owns more than 10% of all five Japanese trading houses it has held since 2020. The five companies include Itochu, Marubeni, Mitsubishi, Mitsui, and Sumitomo. National Indemnity Company increased its Sumitomo stake to 10.05% from 9.30%. Marubeni moved from 9.32% to 10.10%. Itochu Corporation crossed 10.07%. These diversified conglomerates import raw materials and finance domestic industry. They also operate businesses across energy, metals, food, and chemicals.

    The TOPIX reform stages

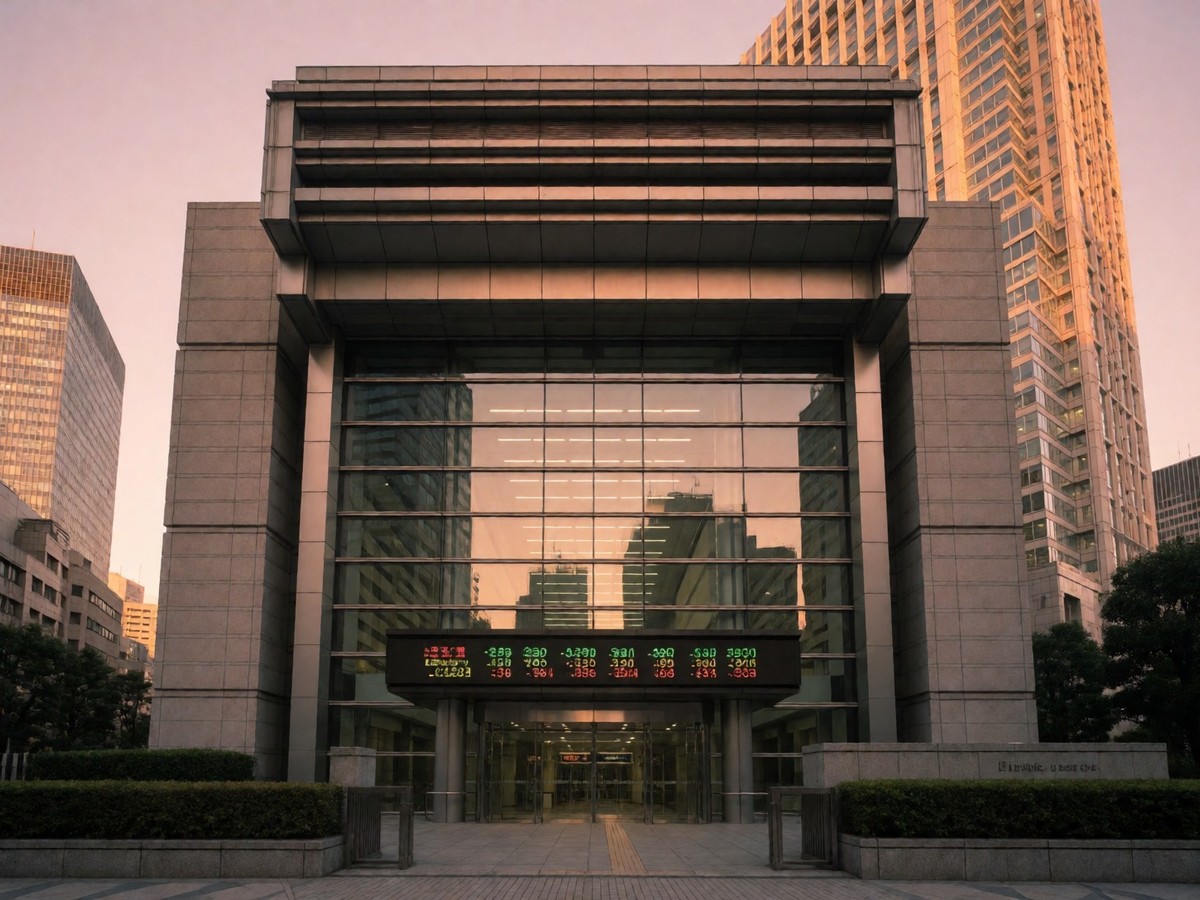
    The Tokyo Stock Exchange (TSE) manages the TOPIX reform in two distinct stages to improve index functionality. Phase 1 focused on listing segments and market capitalization. This phase began in 2022 and targets the exclusion of constituents with a free-float market cap below ¥10bn. The TSE expects this process to reduce the number of index constituents from about 2200 to approximately 1700 by January 2025.

    The future of Japan's TOPIX rebalance and Buffett's trading houses (2)
    Feature Phase 1 Criteria Phase 2 Criteria (Implementation through 2028)
    Target Constituents Top FFMC excluding cross-shareholdings Top 96% of cumulative FFMC
    Minimum FFMC Exclude < ¥10bn Exclude bottom 3% of current constituents
    Liquidity Requirement Not the primary focus Annual Traded Value > 0.2 to include; > 0.14 to avoid exclusion
    Number of Stocks ~1700 by Jan 2025 ~1200 by July 2028
    Market Segment Prime, Standard, Growth Prime, Standard, Growth

    The second stage of revisions introduces a tighter liquidity filter that the TSE will implement through 2028. Companies that fail to meet the new cut-off criteria face gradual weight reductions in the index. This reduction process begins in October 2026 and continues on a quarterly basis through July 2028. The TSE will conduct annual reviews on the last business day of October. For new listings, the index requires the stock to be in the top 95% of cumulative FFMC.

    The transition is gradual.

    Liquidity and index shifts

    The second stage of revisions introduces a tighter liquidity filter that the TSE will implement through 2028. Companies that fail to meet the new cut-off criteria face gradual weight reductions in the index. This reduction process begins in October 2026 and continues on a quarterly basis through July 2028. The TSE will conduct annual reviews on the last business day of October. For new listings, the index requires the stock to be in the top 95% of cumulative FFMC.

    The future of Japan's TOPIX rebalance and Buffett's trading houses (3)

    You should note that the requirements to stay in the index remain slightly more lax than the requirements to be included initially.

    Market concentration risks

    Concentration in the Japanese market increased significantly over the last year. Between July 2025 and July 2026, the ten largest companies’ share of the Nikkei rose from 40.9 percent to 48.7 percent. The three largest sectors’ share also rose from 63.7 percent to 70.8 percent. This trend mirrors the concentration risks seen in South Korea. In South Korea, the KOSPI 200 index contains hundreds of companies, but Samsung Electronics and SK Hynix represent more than 50 percent of its market capitalization. The concentration in the KOSPI index is even more striking because both Samsung Electronics and SK Hynix are major players in the semiconductor industry, yet the index plummeted by over 20 percent after recent earnings reports. Concentration creates risks. Will the concentration in the Nikkei trigger a Korean-style meltdown?

    Regulatory shifts in governance

    Spring 2026 brought a coordinated review of Japan’s corporate governance. The Ministry of Justice (MoJ) proposed lowering the squeeze-out threshold from 90% to 66.7%. This change affects how companies handle going-private transactions. The Financial Services Agency (FSA) also proposed revisions to the Corporate Governance Code. These revisions include the removal or dilution of Principles 1.5, 1.6, and 1.7. These principles previously addressed anti-takeover measures, capital policies harmful to shareholders, and related-party transactions. The interaction between the MoJ proposal to lower the squeeze-out threshold to 66.7% and the FSA’s plan to move Principles 1.5 through 1.7 into non-binding Interpretive Guidance creates a structural risk. Controlling blocs could reach the new 66.7% threshold without broad minority support because they often hold up to 40% to 50% of shares. This is exacerbated by cross-shareholdings. The FSA’s plan to move Principles 1.5 through 1.7 into non-binding Interpretive Guidance reduces the proactive expectations on boards.

    Buffett and the trading houses

    Buffett targets companies with low prices and healthy dividends. The five trading houses provide a margin of safety through cheap yen borrowings. Mitsui trades at 8.6 times earnings. Mitsubishi trades at 10.3 times earnings and 1.16 times book. Sumitomo trades at 10.6 times earnings and 0.9 times book. Itochu fetches 12.1 times earnings and 1.8 times book. Marubeni trades at 9.03 times earnings and 1.13 times book. Total yields for these companies remain attractive. Mitsubishi’s total yield reached 7.84% and Mitsui’s reached 7.25%. Marubeni’s total yield reached 4.75%. Sumitomo and Itochu provided yields of 4.58% and 4.32% respectively. Buffett chose the five largest companies in the industry to manage his $5 billion investment. Only 13 of the 84 Japanese trading companies have market capitalizations over $1 billion. These companies use operating cash flow and funds from divestments rather than insurance premiums. The companies benefit from a weaker yen. Buffett buys value.

  • Why the 2026 NBA salary cap spike favors Thunder and Spurs rebuilds

    Why the 2026 NBA salary cap spike favors Thunder and Spurs rebuilds

    The $166 million ceiling

    The 2026-27 salary cap reaches $166 million. This projection places a 35 percent max contract at $58.1 million. A 30 percent max contract starts at $49.8 million. A 25 percent max contract starts at $41.5 million. Oklahoma City enters the offseason with -$48.4 million in estimated tax space below the $201 million threshold. San Antonio enters with $47.5 million in estimated tax space.

    The cap increases.

    Why the 2026 NBA salary cap spike favors Thunder and Spurs rebuilds (2)

    The 2026-27 salary cap reaches $166 million, which places a 35 percent max contract at $58.1 million while teams with cap space access a $9.4 million room exception.

    The salary cap spike favors Thunder and Spurs rebuilds.

    San Antonio’s superstars

    Victor Wembanyama earns $16,868,246 for the 2026-27 season. He is 23 years old. He signed a four-year, $55 million rookie scale contract on July 1, 2023. In Game 7 against Oklahoma City, he scored 22 points, grabbed seven rebounds, and recorded one block. De’Aaron Fox earns $49,800,000 in 2026-27. He signed a four-year, $222 million extension on August 4, 2025. Fox scored 15 points, five assists, and three steals in the Game 7 win.

    Wemby dominates.

    The Spurs roster includes Keldon Johnson, who earns $17,500,000 in 2026-27. He signed a four-year, $80 million extension on July 18, 2022. Julian Champagnie earns $13,888,889 in 2026-27. He signed a three-year, $45 million veteran extension on June 29, 2026. Stephon Castle earns $10,015,920 in 2026-27. He signed a rookie scale contract on July 2, 2024. Harrison Barnes earns $8,000,000 in 2026-27. He signed a one-year contract on July 8, 2026.

    Financial Metric Value
    2026-27 Salary Cap $166,000,000
    35% Max Contract $58,100,000
    30% Max Contract $49,800,000
    25% Max Contract $41,500,000
    Oklahoma City Tax Space -$48,400,000
    San Antonio Tax Space $47,500,000

    Oklahoma City’s asset surplus

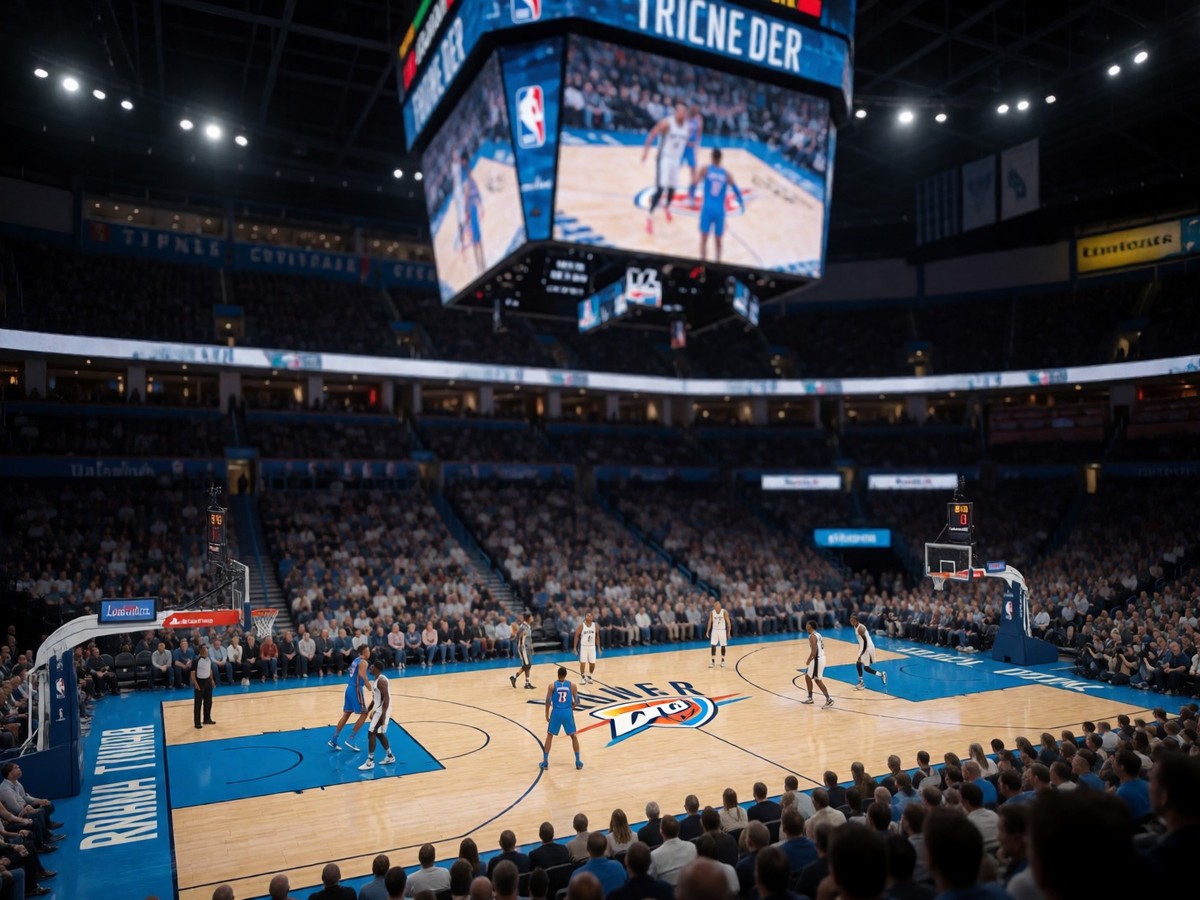
    Oklahoma City holds the Clippers’ unprotected 2026 first-round pick. The team also has swap rights for the 2027 Denver Nuggets pick and the 2027 Los Angeles Clippers pick. Shai Gilgeous-Alexander scored 35 points against San Antonio. The Thunder entered the season with a 15.4 net rating. The team won 64 games in the 2025-26 season.

    The roster remains young.

    Jalen Williams will be 28 in 2030. Chet Holmgren will be 27 in 2030. Cason Wallace is 23. Ajay Mitchell is 24. Jared McCain is 22. The Thunder lost to the Spurs four times in five tries during the regular season.

    Will the Thunder trade for Evan Mobley?

    Managing the 2026 free agency class

    The 2026 free agency class includes Jalen Duren. He is 22 years old. He played for the Detroit Pistons in 2025-26. He earned $6,483,144 and recorded 19.5 points and 10.5 rebounds. James Harden is 37. He earned $39,182,693 in 2025-26. Bennedict Mathurin is 24.2 years old. He earned $9,187,573 while playing for the Clippers.

    You know the cap mechanics.

    Bennedict Mathurin scored 17.6 points and 5.4 rebounds in 2025-26. He is a restricted free agent. Peyton Watson is 24. He earned $4,356,476 and recorded 14.6 points and 4.9 rebounds for Denver in 2025-26. Jonathan Kuminga is 23. He earned $22,500,000 in 2025-26.

    The rivalry and tactical shifts

    The Spurs reached the NBA Finals by defeating Oklahoma City 111-103 in Game 7. Victor Wembanyama recorded 22 points and seven rebounds in that matchup. De’Aaron Fox scored 15 points and five assists in the victory. Chet Holmgren recorded four points on 1-of-2 shooting and two blocks.

    The Spurs won.

    Oklahoma City possesses several other first-round assets. They own the rights to swap their 2028 first-round pick for the Dallas Mavericks’ 2028 first-round pick. They hold swap rights for the 2027 Denver Nuggets pick and the 2027 Los Angeles Clippers pick. Shai Gilgeous-Alexander remains 31 in 2030.

    Financial leverage for the West

    The 2026-27 salary cap reaches $166 million. This puts a 35 percent max contract at $58.1 million. The Oklahoma City Thunder stay competitive because they hold the Clippers’ unprotected 2026 first-round pick. The San Antonio Spurs stay competitive because they hold $47.5 million in estimated tax space.

    The cap is high.

    The Spurs roster includes Keldon Johnson, who earns $17,500,000 in 2026-27. He signed a four-year, $80 million extension on July 18, 2022. Julian Champagnie earns $13,888,889 in 2026-27. He signed a three-year, $45 million veteran extension on June 29, 2026. Stephon Castle earns $10,015,920 in 2026-27. He signed a rookie scale contract on July 2, 2024. Harrison Barnes earns $8,000,000 in 2026-27. He signed a one-year contract on July 8, 2026.

    Oklahoma City maintains several first-round assets including the 2026 Clippers pick and 2027 Denver Nuggets swap rights.

  • Bitcoin trades at $77,701 amid ETF momentum and regulatory shifts

    Bitcoin trades at $77,701 amid ETF momentum and regulatory shifts

    Bitcoin price and ETF momentum

    Bitcoin trades near $77,701 after an 8.2% daily gain on August 21, 2026. On that Friday, spot Bitcoin ETFs pulled in $608 million in a single day. This volume contributed to over $800 million in combined inflows for both Bitcoin and Ether assets. The price level follows an intraday peak of $79,500. Demand remains high.

    The current market action differs from the 2024 halving period. On the day of the April 20, 2024 halving, the Bitcoin price sat at $64,994. During that event, the block reward dropped from 6.25 BTC to 3.125 BTC. Now, the market shows a different character as institutional capital flows into the ecosystem.

    Bitcoin trades at $77,701 amid ETF momentum and regulatory shifts (2)
    ETF Name Ticker AUM (USD)
    iShares Bitcoin Trust IBIT $60.11B
    Fidelity Wise Origin Bitcoin Fund FBTC $13.75B
    Grayscale Bitcoin Trust ETF GBGB $10.53B
    Bitwise Bitcoin ETF BITB $2.99B
    ARK 21Shares Bitcoin ETF ARKB $2.70B
    ProShares Bitcoin ETF BITO $1.51B

    Institutional capital flows into ETFs

    US spot Bitcoin ETFs hold approximately $97 billion in assets. BlackRock’s iShares Bitcoin Trust (IBIT) holds $60.11 billion. This single fund accounts for nearly half of all RIA allocated crypto ETF capital. Institutional investors own 24.5% of all Bitcoin ETF holdings. This ownership shift changes market volatility. You already know how Bitcoin functions.

    The capacity for growth remains immense. American retirement accounts hold over $43 trillion. The 401(k) market holds $9 trillion, while IRAs hold $17 trillion. European institutional assets reach $15 trillion, and the Asian market reaches $20 trillion. A modest 2% to 3% allocation across these pools creates $3 trillion to $4 trillion in potential demand.

    BlackRock’s IBIT alone holds $54 billion in assets. Fidelity has already introduced Bitcoin ETF options in select 401(k) plans. ForUsAll offers cryptocurrency investment options in multiple employer plans. Major providers such as Schwab and Vanguard evaluate Bitcoin ETF inclusion as SEC approval resolves fiduciary barriers.

    Bitcoin trades at $77,701 amid ETF momentum and regulatory shifts (3)

    Miners sell BTC.

    Regulatory frameworks and accounting

    The regulatory environment changed significantly in 2025. President Trump issued an executive order on January 23, 2025, that mandated a federal crypto framework within 180 days. This order rescinded Staff Accounting Bulletin 121, which previously forced banks to hold customer crypto assets on their balance sheets. The SEC also created a Crypto Task Force under Commissioner Hester Peirce. This new group shifted the agency approach from enforcement to a proactive framework of development.

    The GENIUS Act, signed July 18, 2025, establishes a federal framework for payment stablecoins. This law requires 1:1 reserves in high quality liquid assets and mandates annual independent audits. FASB ASU 2023-08, effective January 1, 2025, allows companies to report crypto holdings at fair market value. Strategy, the company formerly known as MicroStrategy, holds 738,731 BTC as of March 2026. Over 172 publicly traded companies hold Bitcoin on their balance sheets. This number increased 40% quarter over quarter in Q3 2025.

    The regulatory shift helps institutions.

    Mining liquidation and profitability

    Publicly traded miners liquidated more than 32,000 BTC in the first quarter of 2026. This quarterly record exceeds the 20,000 BTC sold during the second quarter of 2022. The sale comes as mining economics tighten. Hashprice sits at $33 per PH/s per day. Many operators view $35 per PH/s per day as the breakeven threshold. About 20% of the mining industry operates below breakeven on a cash-cost basis.

    Competitive pressure increases because a rising hashrate means more competitors for the same block rewards. The Miner Reserve metric fell from 1.86 million BTC at the end of 2023 to roughly 1.8 million BTC recently. Miners often liquidate holdings to fund operations, electricity, and equipment upkeep. This creates a tension between miners and treasury holders.

    Treasury buyers accumulate.

    Strategy increases purchases when prices dip. Michael Saylor signals continued accumulation. This behavior creates a divergence between the near term liquidity needs of miners and the long term strategies of corporate buyers.

    Cycle patterns and price floors

    The October 2025 peak marked the calmest top in Bitcoin history. The price fell 51% from that level. This decline is milder than the 77% to 85% falls seen in previous cycles. The market now operates on institutional demand rather than retail frenzy.

    The MVRV value at the October top was 2.29. Previous tops reached MVRV levels between 2.93 and 5.91. The Pi Cycle Top timing signal did not light up during this cycle. Galaxy researchers suggest a base case bottom between $40,000 and $46,000. This bottom should arrive before the end of 2026.

    The price fluctuates.

    The current drawdown remains younger than historical drawdowns on a time basis. Most historical indicators for a cycle bottom have not hit their target levels. The Hash Ribbons recovery cross flipped in early June, which is the first miner side indicator to trigger. Will the DTCC pilot change how markets settle trades?

    Tokenization and the next frontier

    Institutional investors look beyond Bitcoin ETFs to tokenized assets. The tokenized treasury market reached $16.7 billion in 2025. BlackRock’s BUIDL fund approached $3 billion in assets in 2025. Franklin Templeton’s BENJI fund operates across multiple chains.

    The DTCC received SEC authorization for a tokenization pilot in December 2025. This pilot targets US Treasuries and Russell 1000 stocks. The service begins in the second half of 2026. The DTCC oversees $100 trillion in securities and processes $3.7 quadrillion in annual transactions.

    Investors also find opportunities in Ethereum staking. Ethereum serves as settlement infrastructure for stablecoins, tokenized funds, and decentralized exchanges. The total market cap of tokenized real world assets tripled in 2025. Private credit and corporate bonds represent growing areas for tokenization. These digital assets facilitate easier distribution, settlement, and servicing.