
Category: Economy

  • The fragile balance of Argentina’s inflationary stabilization

    The fragile balance of Argentina’s inflationary stabilization

    Inflation reached 33.8% in July 2026. This figure increased from the 33.5% recorded in June 2026. Monthly inflation stood at 2.1% in July. Food inflation hit 34.5% in July. Core inflation reached 32.2% in July. These numbers reflect a persistent pressure that threatens the stability of the current monetary framework. The government faces a difficult path to maintain disinflation while managing a complex exchange rate system.

    The current economic stability relies entirely on external liquidity and political survival.
    The fragile balance of Argentina's inflationary stabilization (2)

    Argentina owes the International Monetary Fund approximately $57 billion. This debt exceeds one-third of the total current lending of the Fund. In April 2025, Argentina negotiated a $20 billion support program. The Fund provided $12 billion of this amount up front. The first review of the program in June 2025 noted that net international reserves stood at minus $4.7 billion. This deficit in reserves creates a massive vulnerability for the repayment of foreign debt. Argentina must pay foreign creditors approximately $45 billion by the end of 2027. This includes $8 billion due through January 2026. Without sufficient reserves, the ability to meet these obligations remains uncertain.

    The US Treasury Secretary Scott Bessent has pledged to do whatever it takes to prevent a disorderly peso devaluation, providing a $20 billion swap line and hundreds of millions of dollars to support Argentina’s fragile economy. This intervention follows a period of intense volatility in the Buenos Aires foreign exchange market. In October 2025, the US Treasury spent approximately $2.5 billion to intervene directly. This action occurred after market participants feared a devaluation following the 2025 midterm elections. Such support provides breathing room, but it also raises questions about long-term sustainability. The US Treasury aims to prevent a scenario where the peso crashes through the top of its allowed band.

    The exchange rate convergence in 2026 suggests a tightening of the various markets. In June 2026, the Blue Dollar reached approximately 1,500 ARS per USD. The official rate sat at about 1,477 ARS per USD. The MEP rate matched the Blue Dollar at roughly 1,500 ARS per USD. These figures show that the historical gap between official and parallel rates has nearly vanished.

    Rate Type ARS per USD
    Official (BNA) ~1,470
    Blue Dollar ~1,500
    MEP Dollar ~1,480
    WanderWallet Rate ~1,520

    The gap closed.

    The new currency framework uses a crawling band to manage volatility. The upper limit of this band rises at 1% per month. The lower limit falls at 1% per month. This system debuted on January 2, 2026. It replaced the previous crawling peg that used a 2% monthly depreciation rate. This new approach allows for more flexibility, but it also removes a mechanical nominal anchor. The lagged indexation of the exchange rate to inflation can impart inertia to price increases. If the economy produces high inflation in one month, the depreciation rate in the following months will automatically accommodate it.

    The government attempts to build reserves through budget surpluses. Milei achieved a fiscal surplus in 2024. This followed deep cuts to salaries, pensions, and public investment. However, the government must also run surpluses to accumulate the dollars needed for debt repayment. These purchases often require the central bank to use pesos, which creates inflationary pressure. The central bank intends to maintain a contractionary monetary bias if inflation stays above international levels. This strategy remains difficult because money demand in Argentina fluctuates heavily. People switch easily between pesos and dollars when they lose confidence in the local currency.

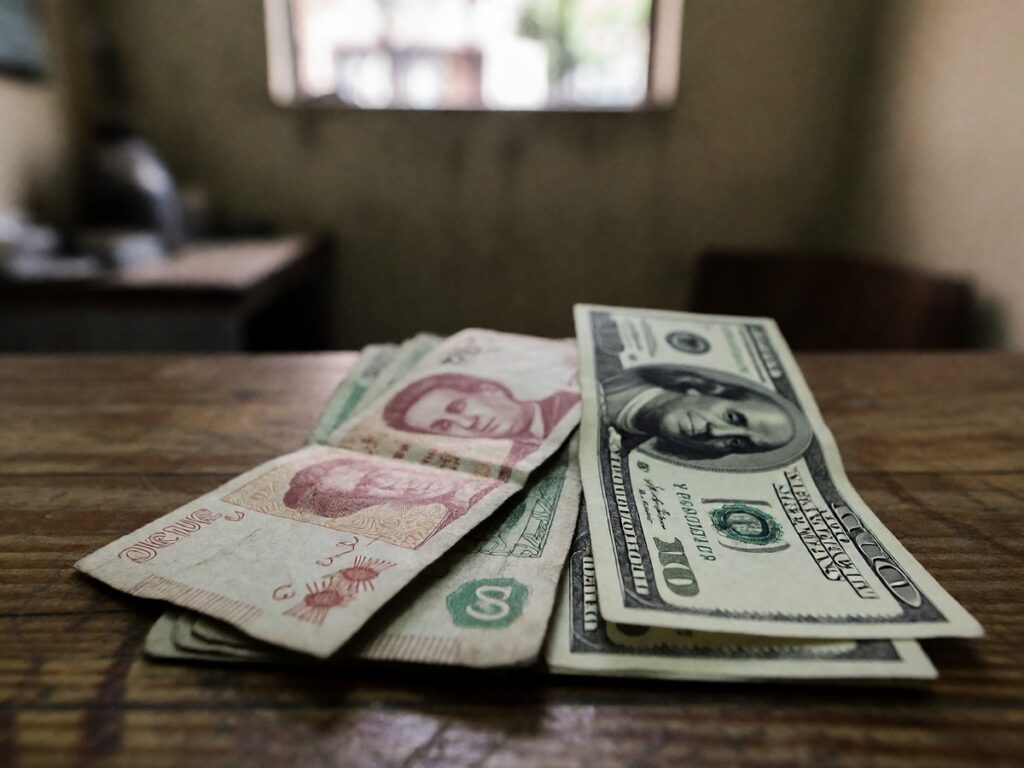
    The cost of living remains a primary concern for the population. A Big Mac costs nearly 60% more in Argentina than in the United States. This reflects the overvalued status of the peso. The wide range of exchange rates also dictates how visitors and locals spend money. The Blue Dollar, or informal cash market, requires clean $100 bills and physical visits to exchange houses called cuevas. The MEP rate, derived from securities trading, applies to foreign cards. In 2026, the MEP rate remains very close to the Blue Dollar.

    You know how quickly Argentine markets move during election cycles.

    The differences in exchange methods involve specific costs and convenience levels. Using a foreign credit card involves an MEP rate that usually lags the Blue Dollar by 2-3%. Card companies also charge fees ranging from 2.8% to 6% on average. Travelers often use WanderWallet to access the Dolar Cripto rate through QR codes and Alias payments. This rate typically stays 3-5% better than the MEP rate. Using cash at a cueva involves a 1-3% spread between buy and sell rates.

    The program carries risks.

    The reliance on US Treasury support makes the program vulnerable to shifts in American political priorities. The US intervention aims to support an ideological ally, but the market may eventually test the credibility of this political commitment. If the central bank cannot accumulate reserves, a negative economic shock could force a devaluation. Such a move would threaten the stability of the entire economic plan. The government needs to transition to a more sustainable strategy that does not rely on constant external liquidity.

    The political landscape in Argentina remains highly polarized. The 2025 midterm elections provided Milei with a strong plurality, which helped stabilize the market. However, the ability to sustain vetoes in Congress depends on the number of deputies in the lower house. A loss of political clout would make it difficult to maintain fiscal stabilization and deregulation. The current convergence of rates and the recent US support provided temporary relief.

    Will the central bank maintain the crawling peg if reserves continue to dwindle?

    The convergence of rates and the narrowing gap between the official and Blue Dollar suggests a move toward unification. The authorities continue to manage the exchange rate to anchor inflation expectations. This strategy relies on the ability of the central bank to buy dollars without triggering massive peso selloffs. The stability of the peso remains tied to the success of the IMF program and the continued support of the US Treasury.

  • The updated scale of the Nigerian economy

    The updated scale of the Nigerian economy

    The National Bureau of Statistics updated the Nigerian GDP base year from 2010 to 2019 during the 2025 rebasing exercise. This change captures economic structures before the pandemic. The nominal GDP for 2024 reached N372.8 trillion. This figure equals approximately $243.7 billion. This movement represents a 34.35% increase from the previous N277.5 trillion estimate. While the naira figure expands, the dollar value shrank because of currency depreciation. In 2013, the GDP reached $510 billion.

    The data shifted.

    The updated scale of the Nigerian economy (2)

    The National Bureau of Statistics updated the base year from 2010 to 2019 to capture the structural changes and technological shifts that occurred in the Nigerian economy before the pandemic disrupted market stability. This 2019 base year provides a period of relative normalcy for measurement. The 2024 nominal GDP of N364.6 trillion from other estimates also reflects this expansion. Real GDP shows a different story. Real GDP grew by 3.13% in the first quarter of 2025, which is an increase from the 2.27% recorded a year earlier.

    Statistical shifts in the base year

    Rebasing changes the base-year prices used to value final goods and services. It also updates the weights for different types of goods. The 2025 exercise incorporates new data from the 2019 and 2023 National Living Standards Surveys. It also uses the 2022 National Agricultural Sample Census Survey and the 2021 National Business Sample Census. These sources provide more granularity than the 2010 data. The 2025 methodology includes new areas like modular refineries, pension fund administrators, and the National Health Insurance Scheme. It even includes illegal and hidden activities.

    The new methodology for the Consumer Price Index (CPI) reflects changing spending. The number of items in the CPI basket rose from 740 to 960. The classification divisions increased from 12 to 13. The share of food and non-alcoholic beverages in the CPI fell from 51.8% to 40.1%. The category for restaurants and accommodation services rose from 1.2% to 12.9%. This change helps account for economic shifts like the removal of petrol subsidies. The CPI uses 2024 as the price reference period. It uses 2023 for the weight reference period.

    The economy remains volatile.

    Structural composition and sectoral movement

    The services sector provides 53.1% of the total output. Agriculture accounts for 25.8% of the economy. Industry follows these two sectors. In the 2010 series, the manufacturing share was 1.9%, but the new series shows it at 6.6%. Real estate is now the third-largest subsector. This follows the decline of crude petroleum and natural gas, which fell to fifth place.

    In 2014, the rebasing changed the view of the economy significantly. That exercise moved the base year from 1990 to 2010. It increased the GDP from $270 billion to $510 billion. That increase was 89%. The 2014 rebasing showed the telecommunications sector contributed more than a quarter of the increase. It also included Nollywood and mobile phone services. Traders also became a major contributor after the survey sample increased by ten times. In 2014, the oil and gas share was 32%, but it fell to 14%. Agriculture was 35% in 2014, but it fell to 22%.

    The services sector is large.

    In the 2024 revision, services remain the main driver. The services sector accounts for 53.1% of output. Agriculture accounts for 25.8%. Industry remains smaller. The manufacturing sector contracted in relative importance. Agriculture remains a large, labour-intensive sector.

    Economic Metric 2014 Rebasing Figures 2025 Rebasing Figures
    Base Year 2010 2019
    Total GDP (Naira) 80.2 trillion 372.8 trillion
    Total GDP (USD) $510 billion $243.7 billion
    Services Share 51% 53.1%
    Agriculture Share 22% 25.8%
    Informal Employment – 93% (Q2 2024)

    The invisible engine of informal labor

    The informal economy accounts for 42.5% of Nigeria’s rebased GDP. One sociological study by Talabi Ezekiel Adetola at Orebro University pegs the informal sector at 65% of GDP. Other estimates place the contribution between 55% and 65%. The National Bureau of Statistics reported that 92.3% of employment was informal in 2023. This rose to 93% in the second quarter of 2024. Urban informal employment accounted for 89% of urban jobs.

    You know the scale of the Nigerian market.

    The informal sector includes street trading, artisanal production, small-scale transport, and domestic services. These activities contribute to the GDP but stay outside formal regulatory frameworks. A one percent increase in the informal sector size associates with a 0.38% rise in long-run formal GDP per capita. Many businesses reach far beyond street markets. Fintech unicorns and startups operate within these flows. Moniepoint processed $17 billion in monthly transactions in 2024. PalmPay served 1 million SMEs in 2025.

    The figures rose.

    Digital growth and fintech expansion

    The digital economy will contribute 21% of GDP by 2027. Current digital economy revenues sit between 16% and 18% of GDP. The ICT sector accounted for 19.8% of real GDP in the second quarter of 2024. Digital revenues grew from $5.09 billion in 2019 to $9.97 billion in 2021. Nigeria is a Co-Champion of the AfCFTA Digital Trade Protocol. The legislature considers the National Digital Economy and E-Governance (NDEG) Bill. This bill would align national law with the AfCFTA Digital Trade Protocol.

    The NDEG Bill would enable electronic bills of lading. This could change how customs and logistics firms handle cross-border transactions. The digital economy includes mobile money transactions and music royalties. Fintech firms like Moniepoint raised $110 million in 2024. PalmPay reported 35 million registered users in 2025. These firms are part of the faster-growing sectors. The digital economy drives much of the current structural change.

    Trade liberalization and AfCFTA integration

    Nigeria adopted its tariff liberalization schedule in April 2025. This schedule covers 80% of traded goods. Nigeria ratified the Digital Trade Protocol in November 2025. As a member of ECOWAS, Nigeria follows a ten-year timeframe for tariff elimination. This allows Nigerian companies to access preferential tariffs across participating economies.

    The African Continental Free Trade Area (AfCFTA) includes 54 of the 55 African Union member states. It aims to close the gap in intra-African trade. Currently, intra-African trade is 14% of the continent’s total. Nigeria’s GDP in 2025 was roughly $290 billion. Full implementation of AfCFTA could boost Africa’s exports to the rest of the world by 32% by 2035. It could lift 50 million people out of extreme poverty.

    Trade barriers remain. Twenty-six member states have not implemented tariff liberalization. Four states, Libya, Sudan, South Sudan, and Eritrea, have not ratified the agreement. Infrastructure gaps and fragmented border systems keep trade costs high.

    Will the NDEG Bill pass the legislature?

    Fiscal ratios and debt management

    Rebasing changes the debt-to-GDP ratio. It fell from 52.13% to 39.4% following the 2025 update. This does not change the actual debt amount. The debt-to-GDP ratio was 52.13% before the new calculation. A larger GDP denominator improves this ratio. The World Bank guideline for debt-to-GDP is 55%. The government’s threshold is 40%.

    The tax-to-GDP ratio reached 13.5% in 2024. A larger GDP does not change the actual tax revenue. The ability to service loans depends on revenue flows. Nigeria faces high debt servicing costs. The country faces weak revenue mobilisation efforts.

    The growth is slow.

    Regional context of rebasing

    Other African countries also rebase their GDP. Kenya, Tanzania, Uganda, and Zambia all rebased in 2014. In Kenya, the 2013 rebasing increased per capita income from $994 to $1,269. This moved Kenya from low-income to lower-middle-income status. Tanzania’s GDP grew by a third after its rebasing. Uganda’s GDP rose by 13%. Zambia’s GDP increased by a quarter.

    In Tanzania, the 2007 benchmark rebasing showed agriculture at 26.8% and industry at 20.2%. The services sector was 47.6%. In Uganda, the 2013 rebasing showed manufacturing rose from 8.0% to 10.0%. Agriculture was 24.8% and services was 47.1%. These changes show structural shifts across the continent. Most African economies show an increase in services and a decrease in industry or agriculture.

    The path to a trillion dollar economy

    Nigeria wants a $1 trillion economy by 2030. A $240 billion economy requires 33% annual growth to reach this target. This rate exceeds the growth China achieved during its expansion. The goal remains ambitious.

    The 2025 rebasing provides a clearer picture of the economy. It shows the importance of the services sector and the digital economy. It also shows the scale of the informal sector. The manufacturing sector remains small. The tax-to-GDP ratio remains low. The country needs structural reforms to reach its target. These reforms include diversifying exports and strengthening institutions. Nigeria must also address currency volatility and inflation. The path to $1 trillion requires more than new statistical data.

  • How India’s Q2 2026 manufacturing surge impacts Asian exporters

    How India’s Q2 2026 manufacturing surge impacts Asian exporters

    India’s manufacturing acceleration

    India’s GDP grew 8.2% in the second quarter of fiscal year 2026. This expansion marks a six-quarter high. Manufacturing grew 9.1% year on year. This figure outpaces the 2.2% growth from the same period last year. The secondary sector, which encompasses manufacturing and electricity, grew 8.1% annually. This surpasses the 4.0% growth recorded in the same period last fiscal year. Industrial output strengthened as the Index of Industrial Production rose 4.1% on average during the September quarter. This follows a 2.7% rise the year before. Private consumer spending, which makes up 57% of GDP, rose 7.9% year on year. Agriculture grew 3.5% in the second quarter. The mining sector contracted 0.04%.

    New Delhi’s trade realignment

    New Delhi shifted focus to China after U.S. tariffs hit 50%.

    How India's Q2 2026 manufacturing surge impacts Asian exporters (2)

    India’s exports to China rose 67% in December to $2 billion. Shipments to the U.S. dropped 1.8% to $6.8 billion. This drop followed steep tariffs from President Donald Trump. India’s trade with China reached $110.20 billion between April and December 2025. This value exceeded the $105.31 billion trade with the U.S. in the same period. India holds an $81.7 billion trade deficit with Beijing. It maintains a $26 billion trade surplus with Washington. India’s exports to mainland China rose nearly 37% during the first nine months of the fiscal year ending March 2026. Shipments to Hong Kong jumped more than 25% in that period. Relations between the two nations have thawed since Prime Minister Narendra Modi and Chinese President Xi Jinping met at the Shanghai Cooperation Organization summit in September. China acts as India’s largest goods trading partner. Foreign Secretary Vikram Misri met Vice Minister Sun Haiyan in New Delhi to discuss stabilizing bilateral ties. India’s trade secretary Rajesh Agrawal said the country is near a deal with Washington.

    Vietnam’s industrial momentum

    Vietnam’s GDP grew 8.4% in the second quarter of 2026. This follows 7.9% growth in the previous quarter. The industrial sector grew 10.5% year on year. This exceeds the 9.0% growth recorded in the first quarter. The agricultural sector grew 4.1% compared to 3.7% in the first quarter. FDI reached $13 billion in the first half of 2026. Samsung, Amkor, and LG Display drove these capacity build-outs. Vietnam is on track to record the fastest growth rate in ASEAN. The government targets 11.9% growth in the second half of the year. This aims to reach a 10% growth target for 2026. Vietnam’s GDP grew.

    The shift in Asian investment flows

    Total newly registered FDI into Vietnam reached $24.8 billion in the first five months of 2026. This represents a 34.9% increase year on year. Singapore led with $8.5 billion. South Korea followed with $6.7 billion. Mainland China ranked third in total registered capital. Indonesia recorded $1.74 billion in registered capital. These five economies account for 85% of total registered FDI. Large projects like the $4.9 billion Can Gio International Transshipment Port and the $2.2 billion GS Nha Be Metrocity project shaped the investment environment. The $2.1 billion AI data center in Tan Phu Industrial Park also contributed to these totals. Thai Nguyen province led FDI attraction with $7.6 billion.

    Export product composition

    Electronics exports dominate the Vietnamese economy.

    Electrical machinery and equipment (HS 85) accounts for 40% to 50% of Vietnam’s top exports. In the first quarter of 2026, shipments of electronic products and semiconductors increased by over 40% year on year. Phone exports rose 23.1% in that period. The U.S. buys 32% of Vietnam’s exports. China buys 15%. Machinery (HS 84) grew 18.2% in the first quarter of 2026. Vietnam is the world’s second-largest coffee producer. It is the largest producer of Robusta beans. Footwear remains a major category. Vietnam produces shoes for Nike, Adidas, and Puma. Furniture (HS 94) exports benefit from the EVFTA. The U.S. is the largest market for Vietnamese furniture. The industry uses the substantial timber and wood-processing sector in Vietnam.

    Metric India Vietnam
    Manufacturing Labor Cost $2-3 per hour $294-347 per month
    FDI (Jan-May 2026) Not specified $24.8 billion
    Top Export Market Not specified USA (32%)
    Industrial Land Cost $30-60 per m2 $177-200 per m2
    Trade Agreement Access Not specified 16 active FTAs

    Comparative costs and incentives

    India’s PLI scheme allocates INR 9,000 crore to electronics and IT hardware for 2025-26. This is an increase from INR 5,777 crore in 2024-25. The program covers 14 sectors. Vietnam’s new Corporate Income Tax Law, effective October 2025, offers a 10% preferential rate for 15 years in AI and semiconductors. This applies to projects in high-tech parks. In India, labor costs in the organized sector average $2 to $3 per hour. Vietnam’s factory workers earn VND 7.7 to 8.4 million per month. Social insurance in Vietnam adds 22% to base costs. India’s social security adds 17% to 20% to base costs. India’s labor costs remain 15% to 25% lower than Vietnam at comparable skill levels.

    Infrastructure and land realities

    Vietnam has many industrial zones. Northern zones have occupancy rates above 80%. Southern zones have occupancy rates between 89% and 92%. Land costs in northern Vietnam reach $177 to $200 per square meter. India’s Tier 2 cities like Pune or Coimbatore offer land at $30 to $60 per square meter. India’s National Infrastructure Pipeline involves INR 111 lakh crore. Dedicated freight corridors and Sagarmala port modernization support growth. You should prioritize India if you want to reach 1.4 billion consumers. Will the U.S. Section 301 investigation result in higher tariffs for Vietnam?

    Direct market recommendations

    Vietnam’s export story changed as it moved into electronics. The country is one of the largest furniture exporters. It is also a top three apparel exporter. The US market accounts for 32% of Vietnam’s exports. China remains a vital partner, acting as both a supplier and a second-largest buyer. Because the U.S. applied a new 12.5% levy on Chinese products in late July, manufacturers rushed to ship goods ahead of potential new tariffs, which drove Chinese exports up 23.9% to a total of $397.85 billion. India’s manufacturing grew. China’s exports rose. Vietnam’s GDP grew. India remains the best option for domestic market access. Vietnam provides a better platform for pure export operations.

  • July unemployment rate and the Sahm Rule recession signal

    July unemployment rate and the Sahm Rule recession signal

    The unemployment rate rose to 4.3% in July, up from 4.1% in June. This jump marks the highest unemployment level in nearly three years. The Sahm Rule reading for this period is 0.53%, which is an increase from the 0.43% reading in June. While the 4.3% figure is still historically low, the speed of the increase has caused concern. I see these numbers as a signal that the labor market is softening.

    The mechanics of the Sahm Rule

    The Sahm Rule tracks the three-month moving average of the national unemployment rate. It compares this moving average to the lowest three-month moving average from the previous 12 months. A recession becomes likely when this difference is 0.50 percentage points or more. In July, the three-month average unemployment rate was 4.30. This is 0.13% above its low for the previous 12 months according to some data. Another calculation shows the 4.3% rate is more than a half point above the 3.6% average from one year ago. The Bureau of Labor Statistics (BLS) publishes this data. They collect information through the Current Population Survey (CPS), which interviews households, and the Current Employment Statistics (CES) survey, which gathers information from employers. The Sahm Rule uses only this single data series. This simplicity makes it a popular tool for identifying downturns. Since 1950, the rule has signaled every one of the 11 recessions. It typically signals a recession about three months after it starts. The rule has only one false positive in its history. That false positive occurred in 1959. Even then, the US entered a recession six months later.

    The Bureau of Labor Statistics (BLS) publishes the monthly unemployment rate. This data comes from the Current Population Survey (CPS), which interviews households, and the Current Employment Statistics (CES) survey, which gathers information from employers. The rate shows the percentage of the total labor force that is unemployed but actively seeking employment and willing to work. The BLS is a unit of the United States Department of Labor. This monthly report is part of the broader Employment Situation Summary.

    Market volatility and economic fear

    The rising jobless numbers caused immediate turmoil in the stock market. The Dow Jones Industrial Average fell 363 points, or 1.5%, on Friday. The S&P 500 index dropped 1.4%, though one source says it fell 1.8%. The Nasdaq Composite fell 2.4%. Investors fear a 4.4% unemployment rate could signal even more weakness. The rise in unemployment suggests a flagging job market. This decline in stocks happened because of fears regarding a soft landing. A soft landing is when the Federal Reserve lowers inflation without causing a recession. Sarah House, an economist at Wells Fargo, says the rising unemployment rate raises concerns about this possibility.

    Labor supply and immigration factors

    The increase in unemployment does not only come from layoffs. The labor force grew by 420,000 workers in July. This increase in the pool of people looking for work can push the unemployment rate higher. Ryan Sweet, the chief U.S. economist at Oxford Economics, says many people left the workforce during the pandemic for health or family reasons. Others returned because of rising wages. Immigration also influenced these numbers. RBC Capital Markets estimates that immigrants filled about one third of the 3 million jobs added in 2023. Goldman Sachs notes that new immigrants often have more difficulty finding work during their first few years in the country. This difficulty can push the unemployment rate higher. The pandemic also created mismatches between jobs and workers. Many workers had to retrain for different industries after the pandemic. Consumer demand shifted from goods back to services, which changed the types of workers needed.

    While the Sahm Rule indicates a recessionary environment by comparing the three-month average unemployment rate to the prior year’s low, the influx of new workers and immigrants complicates the reliability of this specific signal.

    Why the rule may not apply

    Many economists argue the Sahm Rule might not apply this time. They believe the pandemic-era labor disruptions make the rule less reliable. Although unemployment insurance claims have reached their highest levels in more than a year, they remain historically low. This is because employers have been reluctant to cut staff after the COVID-related labor shortages. The economy has been unusually defiant. Gross domestic product has continued to grow. Consumer spending and business investment remain resilient. Household income is also growing. I find the combination of a Sahm Rule trigger and growing consumer spending to be the most important contradiction in the current data.

    Economic Metric July 2026 Data
    Unemployment Rate 4.3%
    June Unemployment Rate 4.1%
    Three-Month Average 4.30%
    12-Month Low Average 3.6%
    Sahm Rule Value 0.53%
    Sahm Rule Threshold 0.50%
    Fed Funds Rate 5.25% to 5.5%
    Inflation Rate ~3%
    2023 Job Additions 3 million
    New Labor Force Entrants 420,000

    The Federal Reserve and interest rates

    The Federal Reserve must manage both inflation and employment. Inflation is around 3%, which is much lower than the 9.1% peak in 2022. However, this is still above the 2% goal of the Fed. Interest rates have stayed between 5.25% and 5.5% since last summer. Jerome Powell, the Fed Chair, says the labor market is normalizing. He is watching to see if the market shows signs of a sharper downturn. Rick Rieder, the chief investment officer at BlackRock, says a September rate cut is almost a given. He believes the current interest rate is too restrictive because inflation is trending lower and labor force slack is building. Elyse Ausenbaugh, the head of investment strategy at J.P. Morgan Wealth Management, says the Fed may have fallen behind the curve.

    The rising unemployment rate reflects a growing number of people looking for work. These include Americans who left during the pandemic to care for children or for health reasons. Others were drawn into the job market by robust wage growth. The job market is feeling these effects. Hiring has dipped well below pre-pandemic levels. The number of people quitting jobs tumbled to 3.3 million in June, which was the lowest level since 2020.

    Assessing the recession risk

    The Sahm Rule is a powerful tool, but it is not a crystal ball. Claudia Sahm, the economist who created the rule, says a recession is not imminent. She says the volume on the Sahm Rule is probably turned up a little too loud right now. She notes that the swing from labor shortages to immigration can magnify the unemployment rate. She also believes the Fed should focus on the second part of its mandate: maximum employment. The labor market is showing real softening. If layoffs continue to edge up while hiring lags, it could push the unemployment rate higher and lead to a recession.

    The jobless rate rose.

    Recession is not imminent.

    Will the Federal Reserve decide to implement a 50-basis-point rate cut in September?